Updating How We Value Drug Companies
Six months of testing our pharma method against company filings and outside data led to four main changes: R&D charged to the drugs it actually pays for, each company's own margins, cash and debt read from the filings, and partner payments charged to the drugs that earn them. Here is where the data supported a change, and where it didn't.
By Bobak Farzin
In April we laid out how we value drug companies: add up the drugs a company sells, the drugs it is developing, and the R&D that will produce drugs nobody has named yet. We valued that last piece with one number, ρ = 1.5, and used BMY as our first example.
We have run that method many times on companies large and small. Each time we found ways to improve it, and we have built a better valuation tool in the process. The general structure has held up, but we have made some significant revisions. Our BMY update shows how they changed the value of one company. The same tool is what we now use on names we have never looked at before, including smaller companies where few analysts do the work by hand.
1. R&D now charged to the drugs it pays for
We went back to ρ and how we applied it. April's version took a multiple of the whole R&D line. But an R&D dollar is split into different streams. Some of it finishes drugs already in late trials, some supports drugs already on the market, and some pays for discovery that will turn into drugs we can't name yet. Amgen is the one company that splits its R&D this way in its filings, and outside cost studies fill in the rest.
So each dollar is now charged once, to the job it does. Drugs in development carry their own cost to finish. Drugs on sale carry their support. Only what is left goes toward future drugs, and that is what our new factor values.
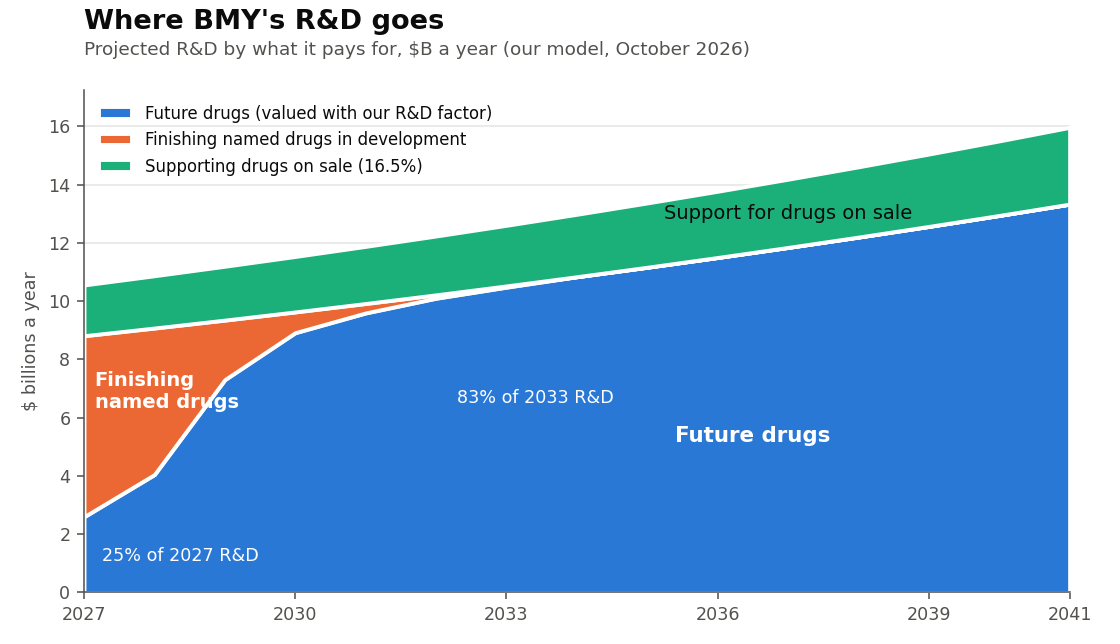
BMY, as we value it now. In 2027 about a quarter of its R&D goes to drugs nobody has named yet; most of it finishes the drugs already in late trials. As those drugs finish, the share for future drugs passes 80%.
Our new factor applies only to the R&D left for future drugs. Because it values a smaller pool of R&D, future drugs now count for less of a company's value than they did in April. Companies do differ, but we found no pattern in the data that tells them apart ahead of time: a company's past R&D productivity didn't predict its future productivity. So we keep one factor for the whole industry.
2. Each company's own margins
We used to set one margin per company by hand. Now we read each company's own product margins from five years of its filings. That held up well: across about a thousand drug companies, an established company's margin level is a strong predictor of its margin years later. What didn't hold up was the idea that the margin a company earns on its newest sales carries forward. We found no relationship there, so we don't use it.
When a company has little or no profitable history to go on, we use an estimate measured on companies at the same stage. As its own record builds, its own margins get more of the weight.
3. Cash, debt and share count from the filings
We had trouble with the cash, debt and share counts from our data vendor. Its cash left out long-term investments. Its debt left out royalty and revenue financings. Its share count missed pre-funded warrants and preferred stock that converts to common. For some smaller companies those gaps moved the value by 20% or more. We now read all three from the latest 10-Q or 10-K, and price each company's debt at the rates its own loans state.
4. Partner deals
Many drug companies share what they sell. Some owe royalties, some split profits with a partner, and some owe guaranteed payments. What a company pays its partner on a drug is a cost of that drug, not of the whole company. BMS is the clearest case. It pays Pfizer about half of Eliquis's profit and books that payment inside its own costs, so the payment used to weigh on every BMS drug. Now we read from the filings what each company pays, and we charge it once, to the drug that earns it. A royalty a company has sold outright no longer counts as revenue or as a debt.
What held up, and what didn't
| what we tested | what we found | what we do now |
|---|---|---|
| Does a company's past R&D productivity predict its future? | No | One R&D factor for the sector |
| Does a company's margin level carry forward? | Yes, strongly | Each company's own margins |
| Does its margin on new sales carry forward? | No | Not used |
| Do single-company betas give a better discount rate? | Too unstable | One sector beta |
| After a patent cliff, is reported revenue a better starting point than a stored peak? | Yes, by a wide margin | Start from reported revenue |
Other updates
- After a patent cliff, each drug's revenue starts from what the company reports, not from a stored peak. In a backtest on seven drugs past their cliffs, the old approach missed by a factor of about five a year out.
- When a drug's protection has ended but no copy is on sale, its cliff comes when a copy is expected, based on how long biosimilars take to reach the market once filed.
- Every fact has a source. Patent dates, molecule types and each company's R&D class are read from filings and checked before they are used. Nothing is filled in by default.
- Past margins come from each filing's own lines, with acquired R&D counted as a cost in the year it is booked.
- One-time payments come out of a company's margin history, so a single upfront fee doesn't make a company look profitable.
- Convertible notes are priced as ordinary debt for now.
What we're seeing
Across our 30 names, the method spreads companies widely. Smaller companies sit around their prices as a group. Large incumbents mostly read below theirs, and almost all of that gap sits after 2030. Our method values today's drugs to the patent dates we can read, and replaces them only through R&D. Large companies are good at extending a drug's life past its patent with new forms and new uses, and we haven't yet found a way to measure that from data. We would rather show that gap and explain it than tune our inputs to close it.
Next comes the November refresh, after third-quarter filings, which puts every company on the updated method. Then we take the method to about 30 smaller companies.
A note on process: this post was written in collaboration with an AI assistant. That should surprise no one — an automated analyst pipeline is what this site is. The valuation model, the numbers, and the sensitivity runs come from that pipeline; the assistant also helped assemble the fact base, check claims against the filings, and draft passages of this post. The thesis, the judgment calls, and the final words are mine. It ships under my name because the responsibility is mine — including any errors.