Why Our Pharma Platform Multiple Is the Sector Average
We wanted to value each pharma's R&D engine separately — give the good ones a bigger platform multiple, the bad ones a smaller one. We tried. The 2018→2025 backtest came back with zero forward predictability. So we use the sector mean of 1.5x for everyone, including BMY.
By Bobak Farzin
Update, October 2026. We no longer use ρ. R&D is now valued by what it pays for, with one factor for future drugs applied to every company (how the method changed). The finding in this post still holds, and it is why that factor is one number for the whole sector: a company's past R&D productivity did not predict its future productivity.
When we wrote about BMY at $59, the load-bearing assumption in the third valuation layer was a single number: ρ = 1.5x. That's the productivity ratio of R&D spend that converts to enterprise value, applied as a sector-wide constant. Every pharma name we model gets the same number.
A careful reader's first question is the right one: isn't BMY's R&D engine different from LLY's, from MRK's, from PFE's? Maybe it is. But we cannot show that it is, going forward, with any data we have. This post explains what we tried, why it didn't work, and why the honest call is to use the sector average.
The negative result, up front
Take six large-cap pharma names — GILD, BMY, MRK, LLY, PFE, AMGN. Compute each one's R&D productivity ratio over the period 2001–2018 (R&D spend in 2001–2006, drug NPV from approvals 2011–2018, with an industry-standard 10-year lag). That's the predictor. Then compute the same ratio for the period 2006–2025 (R&D 2006–2013 → drug NPV 2018–2025). That's the outcome. Rank both:
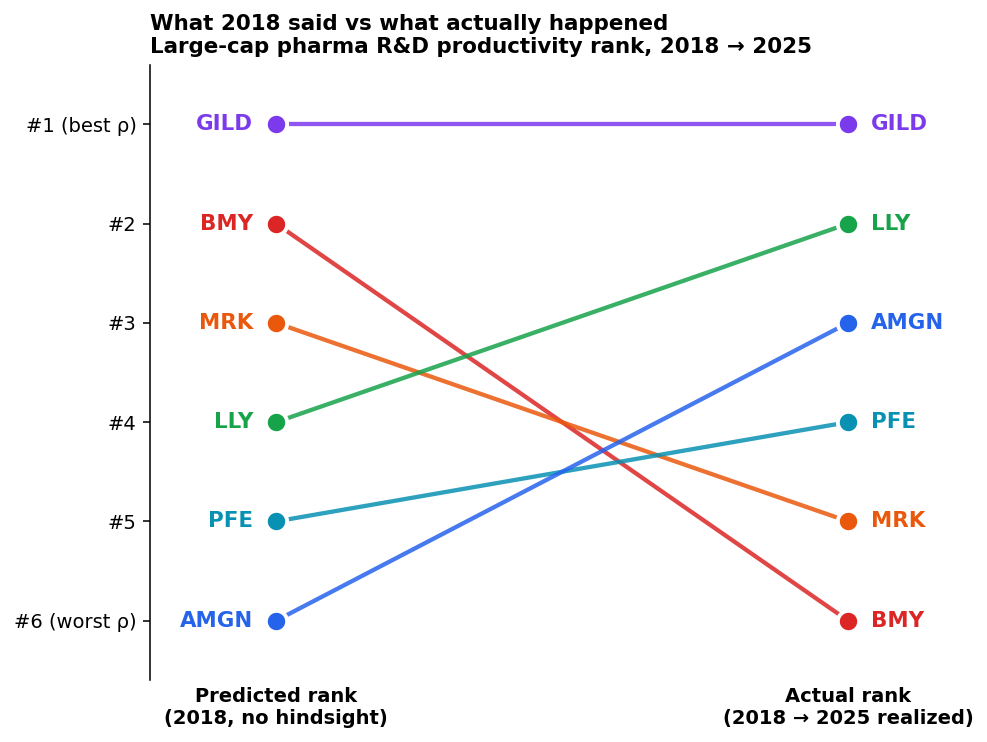
GILD held its #1 rank, but for reasons specific to a single therapeutic franchise (HCV) that came online in the back half of the period — not because the 2018 ranking was a real signal. The other five companies moved sharply, and the moves were not small. BMY went from predicted #2 (one of the best engines in 2018) to actual #6 (the worst). AMGN went from predicted #6 to actual #3. LLY went from predicted #4 to actual #2.
If R&D productivity were a stable company attribute, the lines on this chart would be roughly horizontal. They are not horizontal. Across the five non-GILD names, the average rank shift is 2.4 places out of 6 — close to what random reshuffling would produce.
What ρ is, formally
The pharma-SOTP platform formula is:
Platform PV = annual R&D × (ρ − 1) / (WACC − g) − pipeline rNPV
The ρ ratio is the answer to a single empirical question: how many dollars of approved-drug NPV does each dollar of R&D spending eventually produce? A ρ of 1.0x means R&D is value-preserving but not value-creating. A ρ of 2.0x means each R&D dollar creates two dollars of NPV. The sector mean over our pooled Cohort A (R&D 2001–2010 → approvals 2013–2022) was 1.5x.
The lag matters. Brown et al. Nature Reviews Drug Discovery (2022) anchors R&D-to-approval at 12–15 years, with another 5–7 years from approval to peak revenue. Total R&D-to-NPV lag is 17–22 years. That is why "predict 2018 from 2001–2006 R&D" and "measure 2025 from 2006–2013 R&D" are non-overlapping windows — we are testing whether the productivity attribute is persistent across non-overlapping decades, not whether it shows up in same-period data.
The forward-predictability test
The chart above is a rank visualization of the same data the next chart shows on absolute axes:
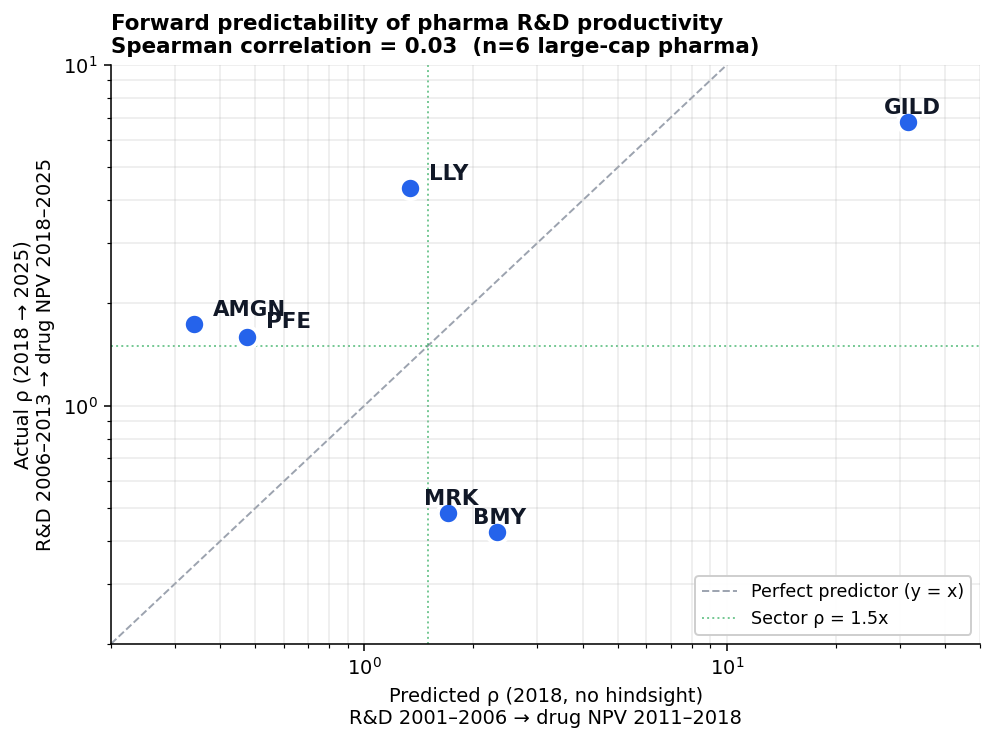
Each dot is a company. The x-axis is what the 2018-vintage ρ ratio said. The y-axis is what actually happened over the next seven years of approvals. If the predictor were even loosely useful, the dots would cluster near the dashed diagonal. They do not. The Spearman rank correlation between predicted and actual ρ is 0.03. Statistical noise around zero.
The dashed green lines mark the 1.5x sector mean on both axes. Note that all points fall above and below it — the dispersion is real. We are not claiming that pharma platforms are identical. We are claiming that knowing yesterday's productivity does not tell you tomorrow's.
What we tried beyond the sector mean
The obvious next move is a multivariate model: maybe ρ alone is a weak signal, but a composite of (recent productivity, pipeline depth, LOE pressure, balance-sheet strength, drug-quality proxy) does better. We built that model. We called it "Path B."
The 5-metric composite produced a Spearman of 0.06 out-of-sample. Up from 0.03, but still effectively zero. When we ran the resulting per-ticker ρ adjustments through the SOTP, fair-value impacts were ±1–2% versus the sector-average baseline. Not material to any actionable thesis. We dropped Path B and kept the sector anchor.
A few specific ideas that also failed:
- Same-window ratios (R&D and NPV in the same decade) — produced a tighter ρ but is structurally wrong, because drugs approved in 2010–2020 were funded by R&D from 1995–2005, not 2010–2020. The "fit" was attribution error.
- Total-ratio with R&D-only denominator — inflates ρ artificially by including acquired drug NPV in the numerator while only counting internal R&D in the denominator. This is the trap our older versions of the model fell into and gave nonsensically high platform values.
- Reverse-engineering ρ from market cap — circular. You're fitting a P/E ratio with extra steps.
Why this is hard (and might stay hard)
There are three structural reasons forward-ρ predictability is so weak:
- Drug NPV is lognormally distributed with a fat-ish tail (σ_log ≈ 1.5 on our 186-drug pooled fit). One blockbuster reorders a company's productivity ratio by itself. LLY's 2018→2025 jump is essentially the GLP-1 franchise; nothing in 2018-vintage data could have predicted that outcome at the magnitude it landed.
- Therapeutic-area regimes shift faster than 12–15 year lags can accommodate. The productivity ratio you observe in any window reflects bets made a decade earlier. By the time you observe them, the company may have already pivoted to the next therapeutic area, with a different productivity profile that won't show up for another 10 years.
- M&A redistributes productivity ownership. When BMY paid $74B for Celgene in 2019, Revlimid's NPV (approval 2005, BMS-financed R&D) shifted onto BMY's ledger. Treating that as "BMY platform productivity" misattributes the value.
What this means for thesis-building
Three implications, in decreasing order of importance:
- Sector ρ = 1.5x is the only anchor we can defend. A claim that "BMY's platform deserves 1.8x because of Karuna and CELMoD" is a story, not a model. We may believe it directionally, but the data does not support sizing on it. The BMY post uses 1.5x for this reason, and the asymmetry it surfaces is without claiming BMY is better than the average.
- Per-ticker bull cases need to be empirical, not productivity-ratio-based. If you want to argue that a specific company's platform is undervalued, the argument has to be about specific assets, specific pipeline reads, specific BD opportunities — not about an abstract "platform quality" we can't measure forward.
- Watching ρ change in the rear-view is fine. Updating ρ from 2018 to 2025 cohorts as new data comes in is the right discipline. Predicting 2032 ρ from 2025 cohorts is not something we should pretend to do.
Open questions
The methodology isn't a closed file. Three things could change our minds:
- A larger N. Six names is a small sample. If we extended to mid-cap biotech (where productivity is clearer because pipelines are concentrated), we might find structurally different forward signal. Likely problem: survivorship bias becomes severe.
- A different decomposition. Maybe forward ρ isn't predictable at the ticker level but is predictable at the therapeutic-area level. Would need 30+ years of TA-level data to test.
- A truly new feature. AI-assisted drug discovery is recent enough that none of our backtest data captures it. If the next 10 years of approvals come disproportionately from AI-first programs (LLY-OpenAI, MRK-Google, NVO-OpenAI, BMY-Google), historical productivity may not be the right reference at all. We'd watch for that signal.
Until any of those resolve, sector mean is the call. Every pharma post on this site that uses pharma-SOTP will use ρ = 1.5x. If you see a ticker-specific override, it will be flagged explicitly with the data behind it.
This is a methodology post. The first application is the BMY thesis, where the layer-3 platform value is the load-bearing assumption. Backtest data: 6 large-cap pharma names, R&D 2001–2013 split into two non-overlapping cohort windows, drug-NPV computation at 10-year lag with σ_log=1.5 lognormal NPV distribution. Spearman correlation pred-vs-actual = 0.03. The full journey doc is at docs/pharma_SOTP_platform/layer3_fit/LAYER3_JOURNEY_SUMMARY.md.