DOX at $63.06: entrenched telecom billing, priced to never grow
At $63.06 the market pays for Amdocs' current $639M of as-filed free cash flow as a flat perpetuity — zero growth, forever. We verified the cash flows to the dollar against twelve years of filings, take the flat case as the price of admission, collect the dividend while we wait, and get any growth for free. 1% position.
By Bobak Farzin
On pricing. Published Tuesday 2026-09-01; prices reference Monday's close (2026-08-31, DOX $63.06). Per our standard convention the model portfolio executes at the next close after publication — Wednesday 2026-09-02. No earnings print is near (FY2026 results land ~Nov 2026).
We have an internal process that searches for consistent FCF compounders and has surfaced an investment idea in Amdocs (DOX). Amdocs is the company running the billing and customer-operations software behind large telecom and media carriers — AT&T, Vodafone Germany, and Liberty Latin America among them. About two-thirds of its ~$4.5B of revenue is recurring managed services on multi-year contracts, backed by a $4.3B twelve-month backlog. This is a first investment with this source so we size it down to 1% to start.
So the investment thesis is this:
- A very steady ~$640 MM a year business. Priced as a flat perpetuity, that is about today's price. Haircut the flat number to $600M and we are ~8% lower; to the 10-year average ($551M), ~16% lower.
- There is positive carry from a dividend right now which has been consistent for many years — $0.569 a quarter ($2.28 a year, a 3.61% yield at our reference close), raised every year since at least FY2014. Not a key driver, but a nice cushion on the valuation.
- If the business shows any growth — first visible on the company's pre-restructuring basis, or in the FY2027 guide they set this December — the same model prices DOX roughly 50% higher. We do not need that to be paid; the flat case is the price of admission and the growth is the free option. That asymmetry is our margin of safety against the errors inherent in this kind of valuation.
There are some key risks that we need to state up front:
- US-listed SEC filer, but a foreign private issuer — Guernsey-incorporated, Israel-rooted. The audited 20-F comes once a year; quarters arrive as furnished 6-K documents we have to read carefully. They are not obligated to give updates beyond that, so the company could effectively go dark at any time (they never have in 27 years, but the floor is the floor).
- CEO transition just started this year (new CEO since March 2026).
- Three cash-flow wrinkles, each different:
- Restructuring payments (~$100M/yr, four years running) are already inside our as-filed FCF number.
- Stock comp (~$87M/yr) is added back by the FCF convention — charge it as an expense and the flat value drops ~16%.
- Capex sits at a decade low ($104M vs $205–231M in past build years) — a new build cycle would cost $50–100M of FCF without anything going wrong.
- AI disruption could break the business in unknown ways, and then even the past FCF could be contracting. This is simply an unknown unknown here and there is no way to hedge it. The 2027 guidance from management will be our first insight into customers and if there has been any actual disruption here. Given the business and the customers — mission-critical billing systems that carriers cannot easily rip out, two-thirds of revenue on multi-year managed-services contracts, and a twelve-month backlog covering most of a year ahead — we would expect the next years of revenues to decay rather slowly. But AI has moved faster and farther than people assumed even months ago, so the future here is uncertain.
The current market price is the zero-growth perpetuity of the current cash flow: the flat FCF that exactly reproduces $63.06 is $642M, against a verified trailing twelve months of $638.8M — a 0.6% gap. Given the track record of ~5%/yr growth over the decade, we believe that is underestimating the future.
| If FCF is flat forever at… | value/share | vs $63.06 |
|---|---|---|
| $500M (punitive haircut) | $47 | −25% |
| $551M (10-yr average) | $53 | −16% |
| ~$552M (TTM less the stock-comp add-back) | $53 | −16% |
| $600M | $58 | −8% |
| $638.8M (verified TTM, as filed) | $63 | −1% |
(Perpetuity at WACC 8.4%, net debt $881M, 107.6M shares. Estimates rounded to the dollar; each $10M of flat FCF ≈ $1.11/share.)
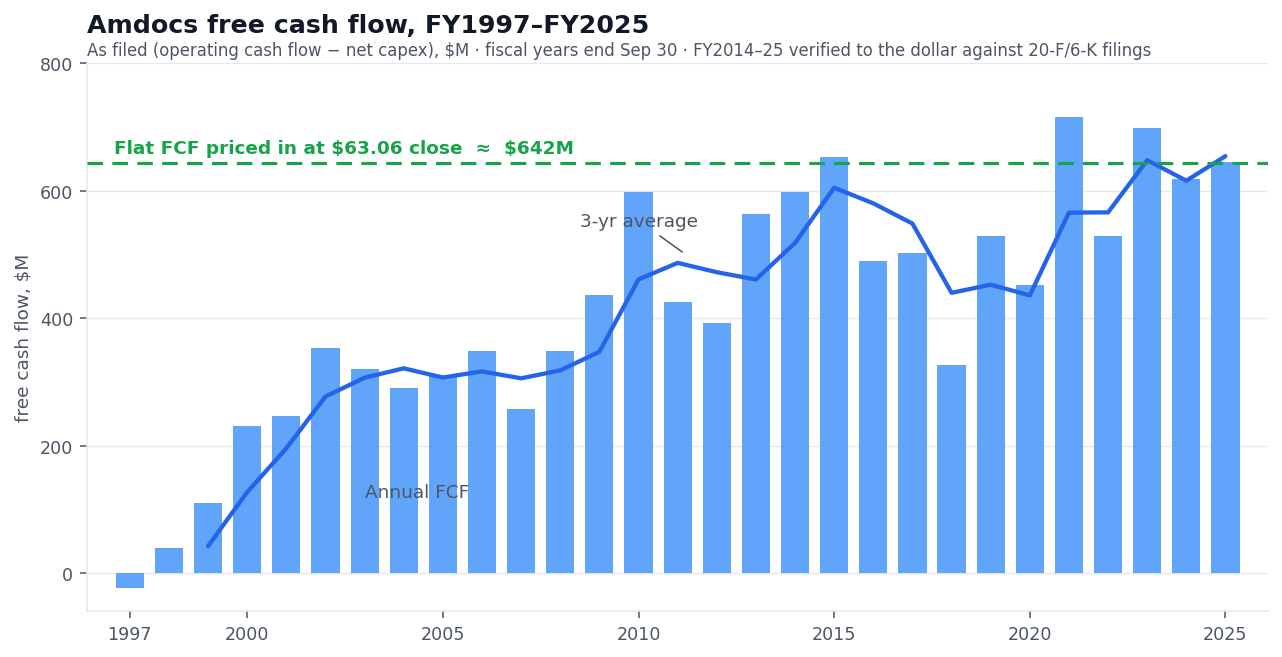
Amdocs is a 20-F (versus a 10-K) filer, which means no quarterly XBRL and no 10-Qs — the quarterly numbers only exist inside furnished 6-K documents. Vendor data for exactly this class of filer is where silent errors live (this same screen caught two other names with mis-keyed cash-flow histories), so we rebuilt the table below by hand from the filings. It matters because the level of FCF is the thesis: pay-for-flat only works if the flat number is real.
Twelve years, verified to the dollar ($M)
| FY | OCF | capex | FCF | buybacks | dividends | returned/FCF |
|---|---|---|---|---|---|---|
| 2014 | 709.3 | 111.6 | 597.7 | 372.0 | 90.9 | 77% |
| 2015 | 772.6 | 120.5 | 652.1 | 454.0 | 100.8 | 85% |
| 2016 | 620.2 | 130.1 | 490.1 | 413.4 | 109.3 | 107% |
| 2017 | 636.1 | 133.4 | 502.7 | 340.6 | 121.5 | 92% |
| 2018 | 557.2 | 231.1 | 326.1 | 419.2 | 134.3 | 170% |
| 2019 | 656.4 | 128.1 | 528.3 | 398.1 | 147.6 | 103% |
| 2020 | 658.1 | 205.5 | 452.6 | 360.9 | 164.1 | 116% |
| 2021 | 925.8 | 210.4 | 715.4 | 680.0 | 177.5 | 120% |
| 2022 | 756.7 | 227.2 | 529.5 | 508.5 | 186.1 | 131% |
| 2023 | 822.6 | 124.4 | 698.3 | 489.5 | 199.5 | 99% |
| 2024 | 724.4 | 105.5 | 618.9 | 563.1 | 212.0 | 125% |
| 2025 | 749.1 | 104.0 | 645.1 | 551.3 | 224.4 | 120% |
| Σ | 6,757 | 5,551 | 1,868 | 110% |
(Every cell from the consolidated statements of cash flow in the 20-Fs; diluted shares 159.5M → 109.7M over the same span.)
How do you return 110% of FCF for twelve years? By spending down a lazy balance sheet: roughly $1.2B of net cash at the start of the period plus ~$0.9B of new debt funded ~$1.9B of tuck-in acquisitions and let the payout run ~10% over FCF. That runway is now used up — cash is $206M and they are issuing commercial paper. From here, returns track FCF: call it ~9.5% of the market cap a year, dividend first (~3× covered by FCF), buybacks as the flex. A slowing buyback from FY2025's $551M pace is the expected arithmetic, not a warning sign.
What you have to believe
- The FY2025 revenue decline (−9.4%) was the phase-out of low-margin work management said it was, not the franchise shrinking.
- Carriers keep outsourcing billing and operations, even as AI changes how that work gets done.
- A plateau defended by ~$100M a year of severance is a company optimizing its cost base, not a business melting. Four straight years of "one-time" restructuring is a run-rate; we treat it as one and charge it against the number.
- Capex stays near today's decade low — no new build cycle.
- Stock comp (13.6% of FCF, roughly tripled since FY2019) stops climbing.
- The once-a-year audit cadence is a monitoring cost, not a hiding place.
What we watch
The FY2026 results land ~November, the audited 20-F in December. We pre-commit to the grading now:
- FY2026 as-filed FCF ≥ $570M holds the plateau (we expect $583–623M if the company's $710–730M ex-restructuring guide is met).
- Timing guard: a print of $530–570M that is fully explained by restructuring payments over $140M (Note 10 of the 20-F) is a timing miss — we re-underwrite, not auto-exit. Below $530M we exit, no excuses.
- The growth trigger: the December call sets the FY2027 guide. A guide at or above FY2026 on the same basis is the first evidence for point 3 of the thesis. Quarterly, we read the 6-Ks for the early tell: unbilled receivables (+$98M YoY today) and DSO (78 days, +5 sequentially) creeping further is what AI-driven project stress would look like before it reaches FCF.
Portfolio action
We open a 1% position at Wednesday's close (2026-09-02). Smaller than other positions because this is the first name from a new screening process (n=1), and the foreign-filer structure carries real monitoring cost and complexity. The re-size trigger is the December print grading clean, not the price moving.
Margin of safety
Investing in the AI age is highly volatile at the moment. It is uncertain what will be announced any day, week or month. However, the near-term cash flows for DOX seem secure. If the business merely stays flat, we own it at about fair value; on the punitive haircuts — a $600M flat number, or the ten-year average — we are down 8–16%, call it 10%. If things turn out to be growing at the decades-long average, then we have a 50% upside to our model. That is roughly a 5:1 payoff that we are willing to consider for the portfolio.
Nothing is capped on the down side, but nothing is capped on the upside either. If Amdocs can find a way to use AI as a tool to provide lower cost solutions to the customers, then there could be an even larger upside in the market.
A note on process: this post was written in collaboration with an AI assistant. That should surprise no one — an automated analyst pipeline is what this site is. The valuation model, the numbers, and the sensitivity runs come from that pipeline; the assistant also verified the cash-flow history against the SEC filings, built the tables and figure, and checked the claims in this post. The thesis, the judgment calls, and the final words are mine. It ships under my name because the responsibility is mine — including any errors.
Model portfolio update
The call above is reflected in our live model portfolio.
Full event history and methodology: /blog/portfolio