USB at $53.42: A 17% ROTCE Franchise at 1.27× Book
U.S. Bancorp earns a top-quartile 16.94% through-cycle ROTCE at 94% of management's target, hedged to rate-neutrality on small parallel moves, and trades at $53.42 against our residual-income fair value of $75. The discount is real and traceable to two specific overhangs — the Category II framework transition and a self-flagged office CRE credit concern — both of which we believe clear over the next 4-6 quarters. We are above sell-side consensus on this name and we explain why.
By Bobak Farzin
U.S. Bancorp trades at $53.42 against $41.92 of book value. Unlike a near-book trade, this is not "we are paying for the existing book and nothing for the franchise." We are paying 1.27× book for a bank that earns 17% on tangible common equity through the cycle, has delivered on 94% of management's 18% ROTCE target through a window that includes COVID and the rate-hike cycle, and runs a balance sheet that has been hedged to near-neutrality on small parallel rate moves. Our residual-income model puts fair value at $75.
The trade is not "USB is cheap because the market is wrong about everything." It is more specific: the discount we are paid to take is traceable to two named overhangs — the Category II framework transition and a company-flagged office CRE credit-quality concern — and we believe both clear or fade over the next 4-6 quarters. Quarterly prints will tell us whether that view holds.
We are also above the sell-side analyst consensus on this name. We address that directly below.
On pricing. This post was published over the weekend of May 16–17, 2026. Our reference market price is Friday's close ($53.42 on May 15). The initial 2% position executed at the Tuesday May 19 pre-market quote ($53.45) — the first available transactable price after publication. We will accumulate toward a 3-4% target only if the market offers favorable prices; this is a name we expect to add to on weakness, not at any price.
The build
  Book value per share                              $41.92
  + PV of explicit-period excess returns             +$8.52
  + PV of fade-period excess returns                 +$7.32
  + PV of terminal residual income                  +$17.27
                                                   ────────
  Residual-income fair value                        $75.04

  Sell-side reference point (not load-bearing)
  ───────────────────────────────────────────────────────
  Consensus target median (23 analysts)             $62.00  ←  our gap to consensus is $13
Two thirds of fair value comes from PV of future excess returns (explicit + fade + terminal); one third is the existing book. The terminal residual income — $17.27 of the $75 — does most of the work, because USB earns 12.4% terminal ROE against a 7.7% cost of equity. That 4.7-percentage-point spread, capitalized as a level perpetuity, is what makes the franchise worth materially more than book.
Why residual income for USB
A bank's value is the book of equity that exists today plus the present value of every dollar of excess return that capital will earn above its cost. For USB, the relevant fact is that the cycle-mean ROTCE is 16.94% measured over 2016-2025 — a window that crosses COVID (2020 ROTCE dipped to ~14%), the rate-hike cycle (2022 peaked above 18%), and the recent normalization. The bank has delivered on that anchor consistently; the standard deviation of annual ROTCE over the window is materially tighter than the cohort median. We trust the through-cycle anchor.
The cost of equity in the model uses Damodaran's Bank Money-Center industry beta of 0.76, the FRED 10-year Treasury yield of 4.46%, and an equity risk premium of 4.23%. That produces a 7.67% Ke. Critically, this is the same Ke we use for every bank in the cohort — there is nothing USB-specific about the discount rate.
Terminal ROE = 16.94% × 0.731 (tangible-equity ratio) = 12.4%. Spread vs Ke = 4.7pp. We do not assume the excess-return base grows (franchise_growth_share = 0 per the Diversified Banks GICS classification). The terminal RI is a level perpetuity, not a growing one. We are not paid for terminal growth; we are paid for the spread persisting.
Why we are above consensus
The sell-side median target is $62, the high is $74, the low is $57. Our RI fair value of $75 sits at the top of the analyst range. This deserves an explicit explanation.
The methodological difference is straightforward. Sell-side targets typically anchor on next-twelve-month earnings multiplied by a peer P/E multiple, with a 12-month horizon. Our RI model anchors on the cycle-mean ROTCE and discounts the implied excess returns over an explicit period, a fade period, and a terminal perpetuity. Both are defensible. They produce different numbers for two reasons:
First, the time horizon is different. A 12-month-target framework discounts to NTM EPS; an RI framework prices the franchise. If you believe USB delivers near-cycle-mean ROTCE for the next decade, the RI value is the right number. If you believe the next year is what matters and the cycle is hard to call, the analyst target is the right number.
Second, the anchor matters. We use realized 10-year ROTCE (16.94%) capped at management's 18% target. Analysts more typically use a 2026-2027 forecast that bakes in conservatism around Cat II compliance costs and any office CRE provision build. That conservatism is reasonable and we don't dismiss it. We just think the cycle-mean is a better anchor than a 2-year forecast that conditions heavily on the overhangs clearing the way we expect.
The honest framing is that we are willing to be wrong on this. If quarterly ROTCE prints drift below 16% over the next four quarters, our anchor is the one that needs revising, not the analyst's. We have committed falsifiers below.
Rate sensitivity: neutral on small moves, asymmetric on big ones
USB describes itself as "relatively neutral to a parallel 50 basis point shift in interest rates, as asset and liability repricing remains closely aligned" at both December 31, 2025 and March 31, 2026.
On larger shocks the picture turns asymmetric: +0.80% NII on a +200bp parallel shock, −1.83% on a −200bp shock (12-month horizon, from the 2025 10-K Item 7A NII at Risk table). The asymmetry comes from non-linear mortgage prepayment behavior and from deposit pricing dynamics that don't reprice fully in either direction. USB carries $36.55B in receive-fixed swap notional (split between fair-value and cash-flow hedges) to manage the exposure.
What does this mean for the thesis? The worst case is a Fed cutting cycle materially faster than the market currently prices, which compresses NII by 1.83% on −200bp. On USB's $16.6B FY2025 NII, that is approximately $300M annualized, or about $0.20 of EPS. Capitalized at our 7.67% cost of equity, the fair-value impact is on the order of $2-3 per share per −200bp — roughly 3-4% of our fair value. Material but not load-bearing. The hedge program is doing its job.
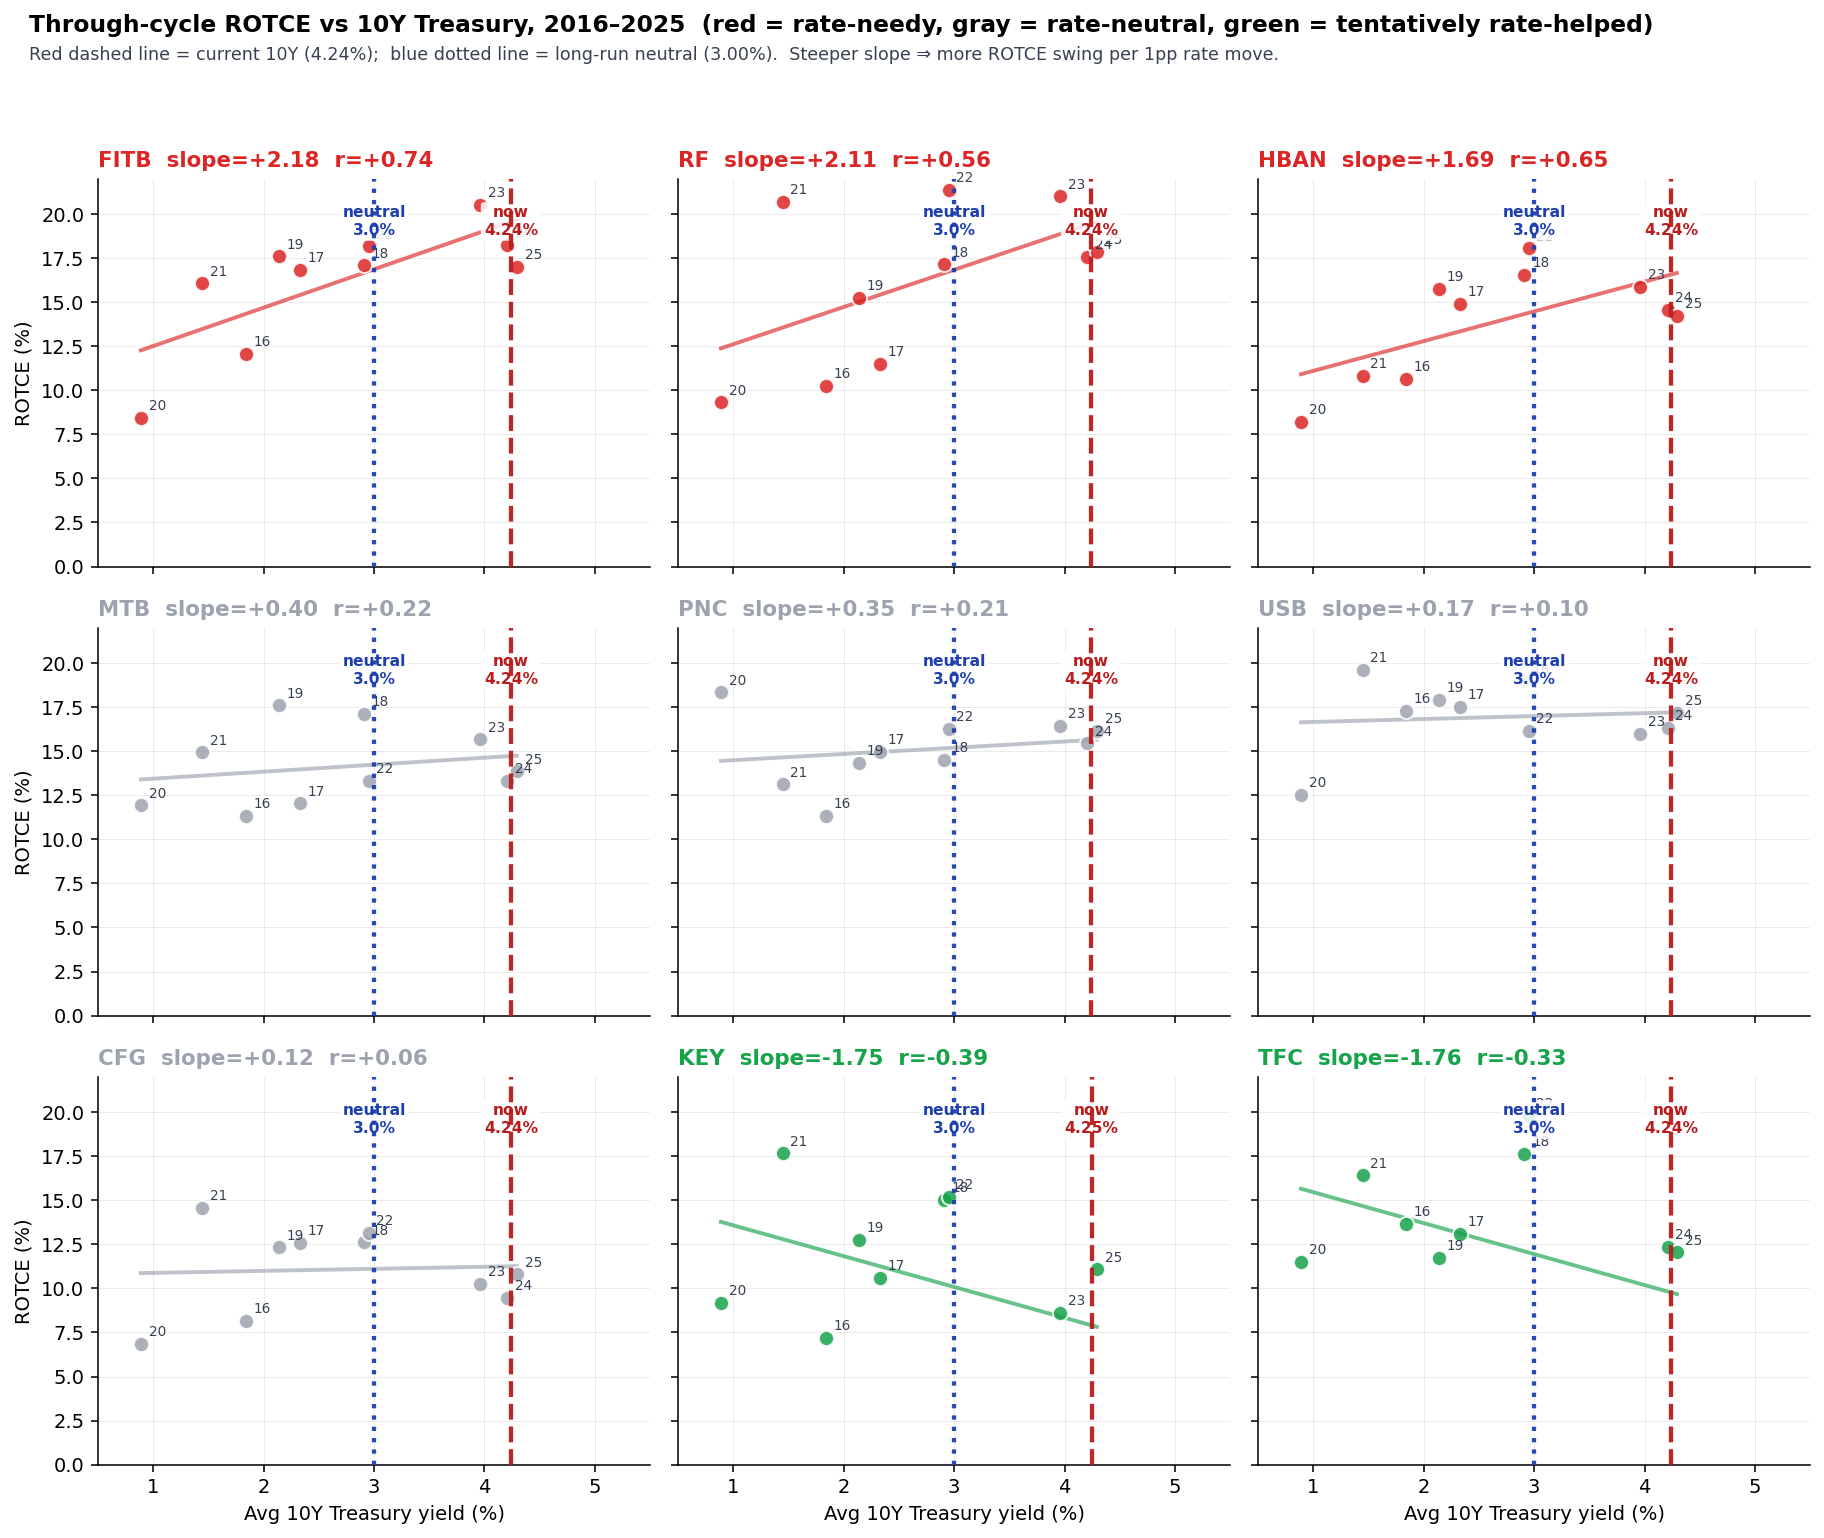
The chart above plots each of the nine super-regional banks' annual ROTCE against the average 10-year Treasury yield in that year. USB sits in the middle row, second from right. The regression slope is +0.17 (nearly flat) with an R² of essentially zero — USB's ROTCE has been remarkably independent of the 10-year rate over the window. That is the picture you want from a hedged, diversified franchise.
Sector context: higher-for-longer removes the worst tail
Our May 16 financials sector briefing flags higher-for-longer as the highest-composite theme of the week (4.8 of 5.0). April wholesale PPI reaccelerated to 6.0% year over year — the sharpest reading since 2022 — and the 10-year Treasury has repriced up about 45bps since March to 4.48%. The combination of a fiscal deficit running at 5.8% of GDP (versus a 50-year average of 3.8%) and an incoming Warsh-led Fed signaling continued restraint argues that the rate cuts priced into the curve in early 2026 keep getting deferred. BAC, BK, and SCHW raised their FY 2026 NII guides on Q1 prints; WFC and COF flagged compression on the liability-sensitive side.
USB's disclosed NII sensitivity is asymmetric — the bank loses approximately 1.83% of NII on a −200bp parallel shock, materially more than it gains on +200bp. In a higher-for-longer regime, that asymmetric tail does not trigger. The 2027 NIM 3% target is also more achievable when short rates stay elevated. The May 16 sector view is not the thesis here — the thesis is ROTCE delivery and the cap-return ramp clearing — but it removes a named downside scenario from the bear case.
Commercial real estate is small, with one self-flagged concern
USB's commercial real estate is 12.5% of total loans, with office at 1.1% of total loans. Both numbers sit below the nine-bank super-regional cohort median of approximately 15-17%. The industry-level $1.26T CRE maturity wall in 2027 is a real macro overhang for the sector, but the concentration is in CRE-specialist banks (Bank OZK 70%, Webster 37%, Valley National 50%), not USB.
That said, there is one specific concern we are obligated to surface, because USB flagged it themselves in the Q4 2025 disclosure: office CRE credit quality is "pressured" and the allowance coverage on office stepped down from approximately 11% to 9% year over year. The company is saying credit quality is getting worse on this segment, and they are not building reserves at the rate one might expect given that.
Two things matter here. First, office is 1.1% of total loans. Even severe stress — 5-10% cumulative NCO on the office book — produces $200-400M of cumulative losses, roughly $0.20-0.40 per share, or about 0.4-0.7% of our fair value. That is real but it is not thesis-breaking. Second, we have committed a falsifier on this. If office NCO runs above 1% annualized for two consecutive quarters AND the allowance isn't rebuilt, the company's own flag was right and we re-assess.
What "on track" looks like quarter by quarter
The catalyst path is not a single binary event. It is a sequence of operating prints over the next 5-6 quarters. We score each one:
| Quarter | Reports | What "on track" means |
|---|---|---|
| Q2 2026 | mid-July | NIM 2.80-2.85%, ROTCE ~17%, buyback maintained at ≥$200M/Q |
| Q3 2026 | mid-October | Amazon partnership launch confirmed and contributing; Cat II framework guidance clearer |
| Q4 2026 | mid-January 2027 | Buyback step-up beyond $200M/Q as Cat II clarity emerges; ROTCE pacing toward 18% |
| Q1 2027 | mid-April 2027 | NIM trajectory to 3% intact; ROTCE 18% |
| FY 2027 | January 2028 | 18% ROTCE delivered in print; payout ratio approaching 70-75% target |
The single most informative checkpoint is the Q4 2026 buyback pace. Management has explicitly tied the cap-return ramp to Cat II framework clarity. If the buyback steps up materially in Q4 2026, the regulatory overhang is clearing on the schedule we expect and the re-rating thesis is intact. If the buyback stays flat or decelerates, the overhang is binding harder than we modeled.
What would make us wrong
Four named triggers, each with a pre-committed consequence:
-
Any quarterly ROTCE print below 15%. The through-cycle anchor of 16.94% is the load-bearing assumption. A sub-15% print without an obvious one-time charge means cycle-mean has shifted lower than we modeled. Trim the position.
-
Full-year 2026 NIM below 2.75%. Management is guiding to a path to 3% by 2027. A 2026 print below 2.75% means asset-yield repricing is not offsetting deposit cost pressure and the 3% target is gone. Reassess the terminal ROE assumption.
-
Office CRE NCO above 1.0% annualized for two consecutive quarters AND allowance not rebuilt. The company has self-flagged office credit quality as pressured. If the cycle bites and they don't reserve into it, the office book becomes a meaningful EPS drag and a multi-quarter overhang. Trim and reassess.
-
Buyback paused or reduced below the current ~$200M/Q pace. The cap-return ramp is the most visible catalyst on the path. A pause means Cat II is more binding than we believed and the re-rating timing is delayed. Reassess and possibly trim.
These are the things we score against each print, not hand-wavy hedges.
Portfolio action
2% initial position at T+1 close (Tuesday, May 19). Target total weight is 3-4%, accumulated toward that range only if the market offers favorable prices over the next one to two quarters.
The smaller initial sizing — and the lower target range — reflects the wider risk profile relative to our other regional-bank position. USB has roughly 29% downside to its book floor at 0.9× book, against approximately 40% upside to our RI fair value. The payoff ratio is favorable but materially less extreme than a near-book trade. The above-consensus call requires conviction in our methodology (cycle-mean ROTCE rather than near-term EPS multiple); the office CRE self-flag from the company adds a near-term operational risk we cannot dismiss; and the regulatory catalyst (Cat II framework clearing) is not on a knowable timeline.
We size accordingly. The 2% starting position lets us own the name now while keeping room to add. If USB trades meaningfully lower on a sector pullback or on a one-quarter delivery wobble that doesn't trigger our falsifiers, we add to 3-4%. If USB rallies before we get the chance, we hold the 2%.
Hold until either method-convergent fair value is approached ($70-75 range) or any of the four falsifiers triggers.
A dividend of $2.00 per share annualized — approximately 3.7% yield at current price — funds the wait.
Margin of safety
The honest book floor is $41.92 (stated book per share). A super-regional franchise with a broken delivery story typically trades at 0.85-0.90× book; at 0.9× book USB is $37.73, or about 29% below current. The downside is real and not capped at book.
The upside to our RI fair value of $75 is approximately 40% from current. That gives a payoff ratio of roughly 1.4×, materially worse than a near-book trade where the downside is essentially zero.
We accept the worse ratio because two things distinguish this trade from a generic regional-bank bet. First, the catalyst path is more visible than for most names: the Cat II framework transition is a regulatory event with a knowable timeline, and the cap-return ramp is already underway. Second, the franchise quality is real — 94% delivery against an 18% target through a difficult cycle is a strong signal that the cycle-mean ROTCE assumption is the right anchor.
The strip-down: at $53.42 you are paying 1.27× book for a 17% ROTCE franchise that is hedged to small parallel rate moves and has 1.1% of loans in office CRE. The model says you are also getting a $15 call option on whether the Cat II overhang clears and the cap-return ramp delivers on management's 70-75% target. Five quarterly prints will tell us whether we collect that option.
Model portfolio update
The call above is reflected in our live model portfolio.
Full event history and methodology: /blog/portfolio