When the History Doesn't Project: Structural FCF Breaks
Our default DCF method extrapolates one of four FCF archetypes — cyclical, mature, secular, declining — calibrated against a ten-year history. When a company crosses a structural break (policy, technology, business model), every archetype is wrong, and the headline fair value will be plausibly precise and structurally meaningless. We explain how we identify the break, why we switch to dcf-multistage with an explicit phase schedule, and why the rule generalizes beyond First Solar.
By Bobak Farzin
A standard discounted-cash-flow model assumes the future looks like some weighted blend of the past. Our dcf-fcff skill does this explicitly: it classifies a company's last decade of free cash flow as a mix of four archetypes — cyclical (oscillating), mature (steady-state), secular (trending), declining (drift toward zero) — and projects the weighted blend forward. For most public companies this is the right tool. The mistake the framework cannot catch on its own is when the underlying business has changed structurally during the lookback window, and none of the four archetypes apply.
This post is the methodology companion to our piece on First Solar, where we caught one of these cases and switched methods. The framing generalizes: when you find a candidate, the question is whether to re-classify the archetype mix or abandon the FCF projection entirely and write a phase schedule by hand.
The negative result, up front
For First Solar, the standard dcf-fcff blend produces a fair value of roughly $235 versus a $201 reference (the cached number from when we caught the case). That looks reasonable. The market is up roughly 17% and the model says fair. A reader would close the page and move on.
But the model is performing arithmetic on a number that does not exist as a single thing. First Solar's ten-year average free cash flow is negative $0.14 billion. The TTM is positive $1.19 billion. The ten-year history contains seven years of negative FCF and a sharp positive break in 2025. No four-archetype blend models a negative-to-positive structural break driven by policy:
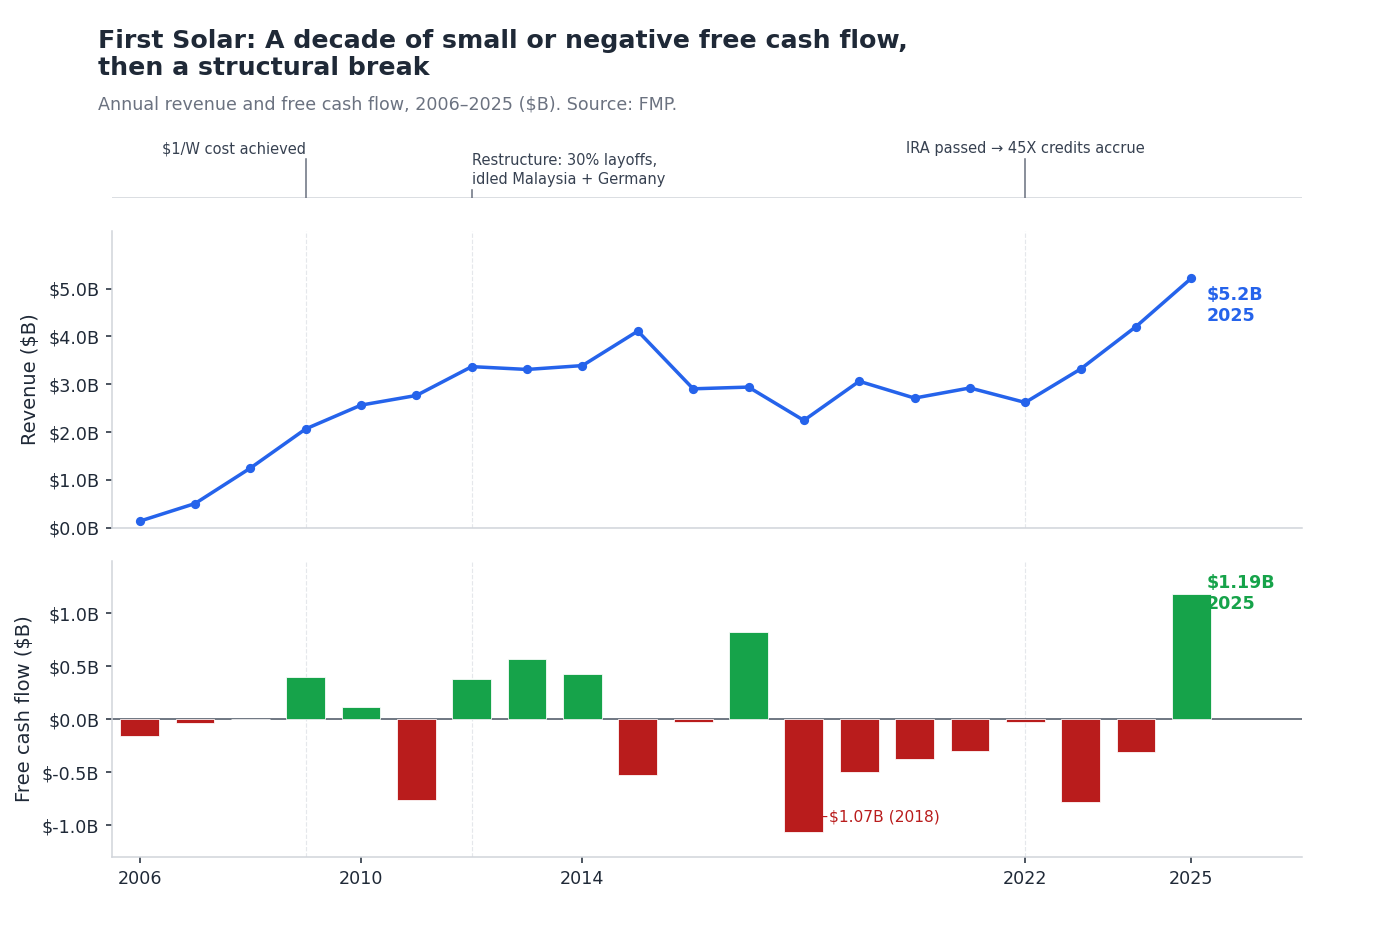
The 2025 inflection is not the end of a cyclical down-leg. It is not a secular trend bending positive. It is not a mature business stabilizing. It is the year that Section 45X production credits started flowing for US-domestic solar manufacturers, and First Solar is a different company on the right side of that line than the left. The blend will give you a number. The number will be wrong in a way that doesn't show up in the model output.
Why the four archetypes don't work
The dcf-fcff archetype model is principled within its domain. Each archetype encodes a different assumption about how the next ten years relate to the last ten:
- Cyclical: FCF mean-reverts to the historical average. The next decade's cumulative FCF roughly equals the last decade's, just on different timing. This is the right model for commodity-cyclicals (CF, miners, refiners).
- Mature: FCF stays near the trailing-twelve-months level. Steady-state, no growth or contraction in the cash-generation engine. Right for consumer staples (KO, PG).
- Secular: FCF grows along its trend line. Right for compounders (V, MSFT).
- Declining: FCF erodes toward zero on a fixed slope. Right for names with cliffs (some pharma at-LOE).
The classifier picks a weighted blend across archetypes — sometimes pure (100% mature for KO), sometimes mixed (60% secular + 40% mature for a slowing growth name). The blend weights are themselves data-driven from the historical series.
Every archetype assumes some form of continuity with the past. None of them encodes "the regulatory regime changed and a $2 billion/year revenue line appeared." When the agent classifies a company with a structural break, it produces a hedge across archetypes that reflects uncertainty about which one applies — not a thesis about what the company actually is now. The headline number ends up reasonable by coincidence, and the underlying classification is meaningless.
How we identify a structural break
Three checks, each independent, each cheap to run before drafting a thesis.
1. FCF sign flip with non-trivial magnitude. If the ten-year average and TTM have opposite signs, or if the sign of FCF has flipped more than once in the last five years with magnitude > 20% of revenue, the underlying business has not been the same business throughout the lookback window. This is what flagged First Solar.
2. The first-principles question: is there a named event that explains the new run-rate? A pre-clinical biotech that just had its first commercial approval. A capital-intensive industrial that just commissioned its first plant. A regulated utility that just got a new rate-base order. A solar manufacturer when a federal production credit lights up. In each case the new run-rate did not exist in the lookback window because the event that produces it did not exist. The classifier is fitting to data generated by a different business.
3. Reverse-DCF sanity check. Compute the implied long-term growth rate from the current price, the current cash flow, and a market-default WACC. If the implied rate is wildly inconsistent with the trailing history but consistent with the post-break trajectory, the market has already re-priced for the break and the model is the last one to find out. For First Solar, reverse-DCF said the market was implying 8.1% growth — perfectly aligned with the post-IRA phase-1 trajectory, nowhere near the 10-year historical average.
If any one of these checks fires, the lookback window contains a regime change. If two or three fire, the case is unambiguous.
What we do instead: dcf-multistage with hand-written phases
The dcf-multistage skill is structurally different. It does not classify against archetypes. It takes three explicit inputs:
- Phase 1 growth and length. Typically 4–8 years. The growth rate is sourced from management guidance, segment-level extraction from the most recent 10-K and 10-Q, or industry-specific evidence (e.g., for First Solar, a contracted-backlog-based 8% growth was the post-IRA-ramp trajectory management has communicated).
- Phase 2 length and a fade schedule. Linear fade from phase-1 growth to terminal growth over another 3–5 years. Phase 2 is not a separate growth assumption — it is the controlled return to steady-state.
- Terminal growth. A long-run steady-state, defended against either Damodaran's sector-calibrated rate or the company's own filings (we use the company-specific extraction when it exists).
The point is that the model no longer relies on the historical FCF series to encode the future. Phase 1 is the company's actual near-term plan. Phase 2 fades it to whatever steady-state we believe is defensible. Terminal is a Gordon-growth-style perpetuity for what comes after. The structural break is honored by simply not extrapolating across it.
For First Solar specifically, our run produced an 8/8/8/8 → 6.75/5.5/4.25/3.0% growth schedule with an EBITDA margin ramp from 44.1% to 49.2%, anchored to the contracted $14.4B backlog through 2030 and management's 2026 guidance. Terminal at 3.0%. PV split 47.5% explicit / 52.5% terminal — under our 70%+ structural-flag threshold, which says the model is not absurdly reliant on the unspecified post-2032 future. The fair value was $221.
The trade-off — and when not to switch
dcf-multistage is more honest but more dependent on the modeler's judgment. The four-archetype dcf-fcff is, in effect, a regularized projection — its discipline comes from forcing the projection to look like a weighted blend of well-understood patterns. dcf-multistage does not have that discipline. If you write a phase schedule with management-bullish assumptions, you get a management-bullish fair value with no archetype-mean to regress toward.
Two rules we use to keep this honest:
-
Phase 1 growth must be sourced. Either from explicit management guidance with a date, or from segment-level revenue arithmetic in a recent filing, or from a third-party industry forecast we can cite. No hand-waved "this seems reasonable." For First Solar, the 8% number is derived from the contracted $14.4B / 47.9 GW backlog through 2030 normalized against the volume sold in 2025.
-
Sensitivity sweep must be visible. We require dcf-multistage to publish a 5×5 sensitivity grid across phase-1 growth and terminal growth. For First Solar, the central FV $221 sits in a grid ranging from $188 (5% phase-1 growth + 2% terminal) to $262 (11% phase-1 + 4% terminal). The reader can pick a different cell.
If neither rule can be satisfied — if Phase 1 growth is genuinely unknowable and there's no third-party anchor — then dcf-multistage is not the right tool either. The honest move is to decline to value: write up the company as out-of-competence with the specific data gap noted, and leave the model unrun. We have a separate methodology for that case; it is not the right path for First Solar, which has clear management guidance and a contracted backlog, but it would be the right path for, say, a pre-commercial cannabis company with no operating history we believe.
Generalizing beyond First Solar
The pattern applies whenever a company crosses a regime change inside its lookback window. Current and likely future candidates in our coverage:
- GE Vernova (GEV). Spun off from GE in April 2024. The lookback is contaminated by the parent-company financials of the legacy GE conglomerate. We use
dcf-multistagewith a hand-written ramp encoding the management-guided EBITDA margin path from 11% (TTM) to 20% (2028 target). - Rivian (RIVN), eventually. Today a pre-commercial-margin EV maker; if and when unit economics flip positive, the TTM-versus-history geometry will look like First Solar's did. The right move at that point is to switch to
dcf-multistagewith an explicit "ramp to unit-economics breakeven" Phase 1. - Cheniere (LNG). Long-term-contracted LNG infrastructure. The dcf-multistage frame is structurally right; what we use today is the closely related
dcf-growth-capexskill, which isdcf-multistageplus an explicit separation of value-preserving capex from value-creating capex. - A subset of industrial spin-offs and post-merger integration cases — companies whose lookback windows mix two different operating businesses. The same pattern.
In each case the underlying methodology question is the same: does the FCF history in your model encode the business you are valuing, or does it encode some prior version of the business that no longer exists?
If you can answer "yes, the history is the business," dcf-fcff is the right tool and the discipline of the archetype model is a feature.
If you cannot, write the phases yourself.
The honest part
There is no general way to detect a structural break automatically. Every check we listed above is a human-readable smell test, not a numerical filter. A future version of our framework could try to formalize it — perhaps a regime-change detection step that runs before classification, perhaps a sensitivity-of-blend-weights diagnostic that flags low-confidence classifications for human review. We have not built that.
Today, the protection is the analyst. The dcf-fcff skill flags its red flags (the model itself caught the negative-history-versus-positive-TTM tension in First Solar and downgraded its confidence). The standing rule in our framework is that a red flag on a primary method is grounds to consider switching methods, not just to caveat the number. The First Solar piece is the worked example of doing that consistently.
When the history doesn't project, the right move is not to refine the projection. The right move is to write the future yourself, defend each phase with data, publish the sensitivity grid, and let the reader pick a different cell if they disagree.
That is what dcf-multistage is for.