FSLR: The Policy Trade Inside a Manufacturer
Our dcf-multistage fair value of $221 sits at the low end of the 9 analysts currently covering the stock. Section 45X tax credits drive a binary-like outcome with risk of a large decline, and we have no informational edge in this area. Not enough margin of safety in our valuation to initiate a position.
By Bobak Farzin
We value FSLR at $221/share using a multi-stage DCF that explicitly models the IRA ramp, a controlled fade, and a 3.0% terminal. This is downstream of two structural questions: whether the 45X credit survives the political risk window of the remaining administration (through January 2029, roughly two and a half more years) intact, and whether the company actually delivers the capacity build and margin ramp it has guided to. The post-2032 question — what happens when the IRA schedule has fully stepped 45X all the way down — sits behind both. Our model lands roughly 7% below the current market and 9% below the consensus median. We are not taking a position in this name because the unmodeled tail (45X cut) is the part that would move the math materially, our 7% gap to market is on the wrong side of that dominant driver, and we do not have an informational edge on the policy half of the bet.
On pricing. This post publishes on Thursday, May 21, 2026. The reference market price is the prior trading day's close: $237.86 on Wednesday, May 20, 2026 (FMP daily, settled). We are not taking a position in this name today; if that changes after a future earnings print or policy catalyst, we will follow our standard T+1 convention and document the entry separately.
How we got here
The chart below shows how we got here:
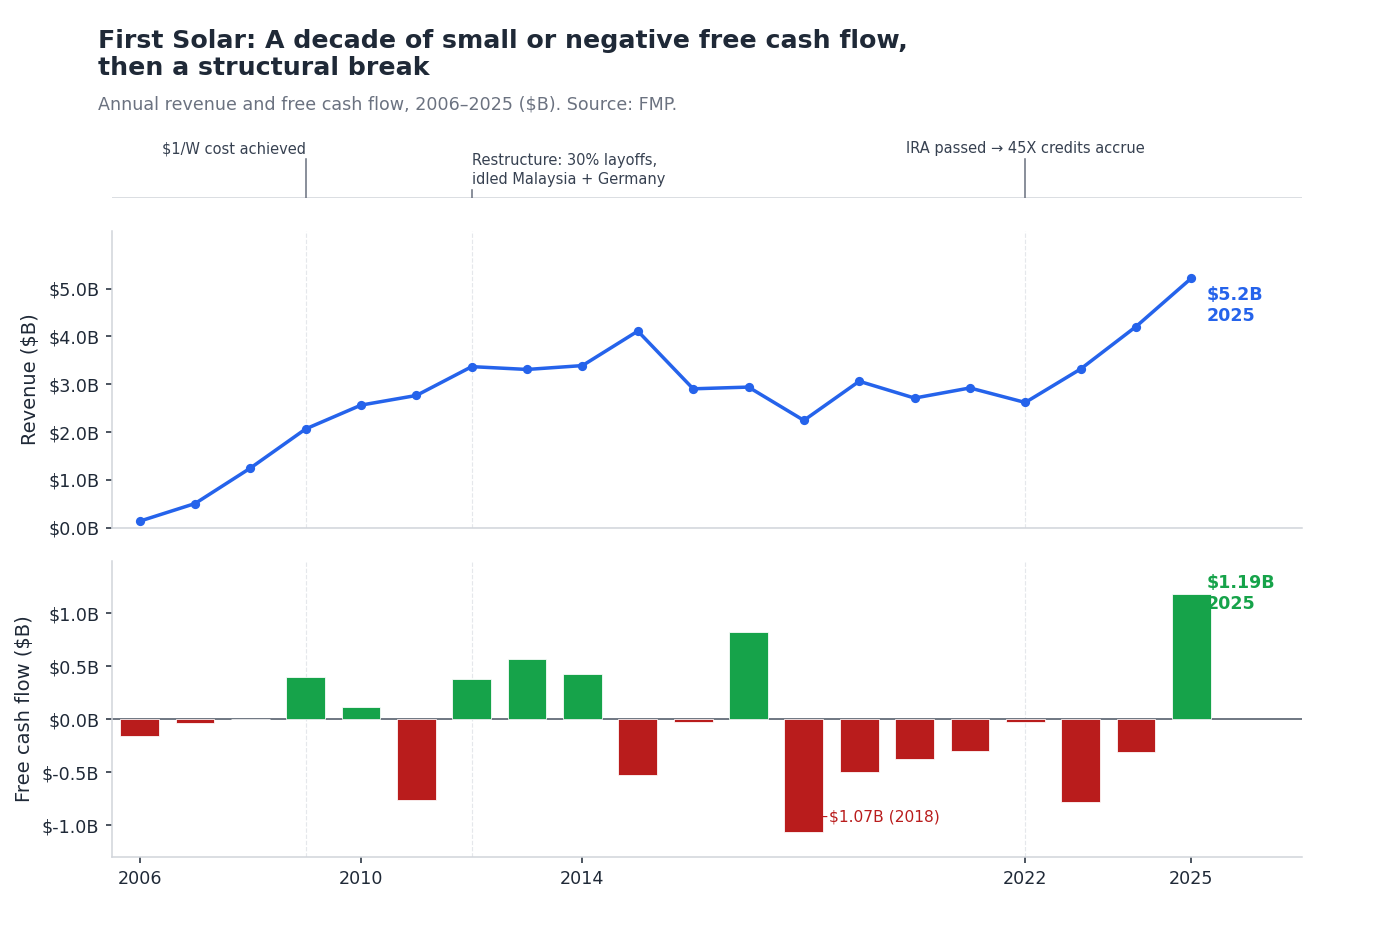
The setup matters because the standard valuation method for a US-listed industrial — DCF on free cash flow — produces nonsense on FSLR's history. The ten-year average FCF was negative $0.14 billion. The trailing twelve months was positive $1.19 billion. There is no archetype within standard FCF projection (cyclical, mature, secular, declining) that models a negative-to-positive structural break driven by policy. Pre-2020 First Solar and post-IRA First Solar are essentially different companies sharing a ticker. We explained the methodology choice in detail in our companion piece on structural FCF breaks; the short version is that you have to abandon trend-extrapolation methods and write the phase structure explicitly.
The 2025 inflection in the chart — $1.19B FCF on $5.2B revenue — is when the 45X credits actually started flowing. The structural break is not a forecasting artifact. It is a policy event. The broader arc, for readers who want it, is in the collapsed section below; the rest of the post does not depend on it.
A quick history (1990 → 2025) — click to expand
- 1990 / 1999. Solar Cells Inc. — a cadmium-telluride thin-film research operation founded by Harold McMaster in 1990 — is acquired in 1999 by True North Partners (Walton family capital) and renamed First Solar. The bet is contrarian: thin-film at a moment when crystalline silicon is winning.
- 2009. First Solar is the first panel manufacturer under $1 per watt and the world's largest PV producer at 1 GW capacity. The market briefly believes the contrarian bet has paid off.
- 2010–2012. Chinese polysilicon production scales and crystalline silicon drops below $1/watt too. First Solar's cost advantage evaporates. The company restructures globally in April 2012 — phasing out the German plant, idling four Malaysian production lines, and laying off roughly 30% of the workforce. CFO Mark Widmar's framing at the time: "We need to resize our business to a level of demand that is highly reliable and predictable."
- 2012–2021. A decade in the wilderness. FCF mixed positive/negative, revenue flat in the $2.5–4B range. The company refocuses on US utility-scale and survives but does not transform.
- August 2022. The Inflation Reduction Act creates Section 45X — a production-based tax credit for US-manufactured solar components. First Solar is, by virtue of having survived the silicon decade as the only US-domestic vertically integrated thin-film manufacturer, the single biggest beneficiary in the industry.
- 2025. The first full year of 45X cash flow lands. FCF turns sharply positive ($1.19B) for the first time on a non-trivial scale. The model in this post is built on what happens next.
The valuation spine: two pillars and a cliff
The dcf-multistage build separates into two periods that are modeled separatly. We break up into the IRA ramp and the post-IRA steady state explicitly:
  Phase 1 (years 1–4): IRA ramp
    + Revenue growth                            8% / year
    + EBITDA margin                          44% → 49.2%
    + 45X credits flow at full rate
    PV of Phase 1                                  $5.2 B
                                                  ────────
  Phase 2 (years 5–8): linear fade
    + Revenue growth fades                6.75% → 3.0%
    + Margin held at 49.2%
    PV of Phase 2                                  $5.0 B
                                                  ────────
  Terminal (year 9+, perpetuity at 3.0%)         $11.3 B
  Total enterprise value                          $21.4 B
                                                  ────────
  + Net cash                                       +$2.3 B
  Equity value                                    $23.8 B
                                                  ────────
  ÷ Shares outstanding                            107.5 M
  ──────────────────────────────────────────────────────
  = Per-share fair value                           $221
The phase structure is the whole story. Phase 1 prices what the company has actually guided to and what 45X is currently scheduled to deliver. Phase 2 is the controlled fade from guidance back to steady-state. Terminal is what survives once the IRA schedule has fully stepped down. PV split: 47.5% explicit, 52.5% terminal — a majority of the valuation depends on what happens after the IRA schedule expires.
The two pillars and the cliff:
| What you have to believe | Direct evidence | |
|---|---|---|
| Pillar 1 | 45X solar credits hold the existing IRA schedule | Steptoe legal: solar component schedule preserved post-OBBBA |
| Pillar 2 | 17 GW US fleet by 2027, 49% EBITDA margin | Q1 2026 print: $1.04B revenue (+24%), 50% adj EBITDA margin |
| The cliff | Something — extension, renegotiation, or new program — replaces the credits post-2032 | Speculative. Terminal value bakes a 3.5% perpetuity that implicitly assumes some continuation. |
We work through each below.
Pillar 1 — credits intact
The One Big Beautiful Bill Act (OBBBA, signed July 4, 2025) made significant changes to IRA-era clean energy tax credits. For wind component manufacturers, OBBBA accelerated termination of Section 45X to "components sold after December 31, 2027" — a hard cliff. For solar component manufacturers, the schedule was preserved at the IRA-era trajectory:
- Full credit through tax year 2029
- 75% of credit in 2030
- 50% in 2031
- 25% in 2032
- Zero thereafter
That phase-down is the cliff in the bottom row of our table. For the first four years of our model, FSLR collects the full statutory credit. FSLR's 2026 guidance for Section 45X credits is $2.10–$2.19 billion — roughly 40% of expected revenue. That is the math that makes the company profitable.
A second layer of customer-side credits — Sections 48E (ITC) and 45Y (PTC) — are the credits FSLR's customers (utility-scale developers) claim when they place a solar project into service. OBBBA accelerated those too: wind/solar projects placed in service after December 31, 2027 are ineligible, unless construction begins by July 4, 2026. That deadline is the single most-watchable demand-side event in this name's six-month calendar. If utility developers rush to commence construction in Q2-Q3 2026, FSLR's backlog should accelerate visibly. If they do not, the demand thesis weakens whether or not 45X survives.
A third layer matters: the OBBBA introduced new FEOC (Foreign Entity of Concern) rules effective August 15, 2025. Credits can be denied if a "Prohibited Foreign Entity" — China, Iran, North Korea, Russia — has ownership, control, or "material assistance" in the production chain. FSLR's cadmium-telluride technology and US-domestic vertical integration largely insulate it (the tellurium supply is global but not concentrated in Chinese sources), but the rules are new and the implementation is uncertain. Worth watching.
A notable detail from the Q1 2026 earnings deck: First Solar is not monetizing 45X credits in 2026. They did monetize $1.17 billion of credits in 2025 (at $0.949 per dollar of face value) — a strategic decision to convert the receivable into cash early at a 5% haircut. In 2026 they are holding the credits on the balance sheet. Q1 2026 operating cash flow was actually negative $215M, and government-grants receivable jumped $198M QoQ to $823M. The decision to hold reflects confidence that the credits will convert to cash later without the haircut, and it improves reported headline 45X line while deferring the cash. The model has to capture this: our input resolver picks up the receivable buildup as part of its 5-year cycle aggregation of working capital and ends at 17% NWC/incremental-revenue, which is a meaningful contributor to the lower fair value. If management pivots to credit monetization in 2H, NWC normalizes lower and FV rises — we flag this in the model's key uncertainties.
Pillar 2 — manufacturing delivery
This is the operational pillar. The question is whether First Solar actually builds out the capacity it has been promising and delivers the margin expansion management has guided to.
Q1 2026 (reported April 30, 2026) is the most recent print and it was unambiguously supportive of the bull side of pillar 2:
| Metric | Q1 2026 | Q1 2025 | YoY |
|---|---|---|---|
| Net sales | $1.04B | $0.85B | +24% |
| Gross margin | 47% | 41% | +6pp |
| Adj EBITDA | $520M | $379M | +37% |
| Adj EBITDA margin | 50% | 45% | +5pp |
| US manufacturing utilization | 96% | — | — |
| Section 45X credits earned | $418M | $300M | +$118M |
Capacity build is on schedule: the sixth US plant in Gaffney, South Carolina (3.5 GW) starts equipment installation in Q2 2026, bringing the US fleet to 17.1 GW by 2027. Backlog is 47.9 GW / $14.4B contracted through 2030, and management says US production is substantially committed through 2028. The 2024 10-K disclosed that no single customer accounted for over 10% of modules-business net sales — a measurable improvement from 2022 when three customers each made up 10–14%. The customer base is less concentrated as the backlog has grown, and 93% of net sales are US (per the 10-K geographic split). Concentration risk is lower than we expected going in.
Two structural tailwinds the company explicitly flagged in Q1: 1. TOPCon IP infringement case at the USITC — if exclusion orders are issued, crystalline-silicon competitors lose access to US imports. 2. Polysilicon Section 232 investigation at the Department of Commerce — national-security-based tariffs or quotas on c-Si imports would further widen FSLR's domestic-pricing advantage.
Both are policy-adjacent tailwinds that could materialize on a six-month horizon. Neither is in our model.
What the analyst distribution actually looks like
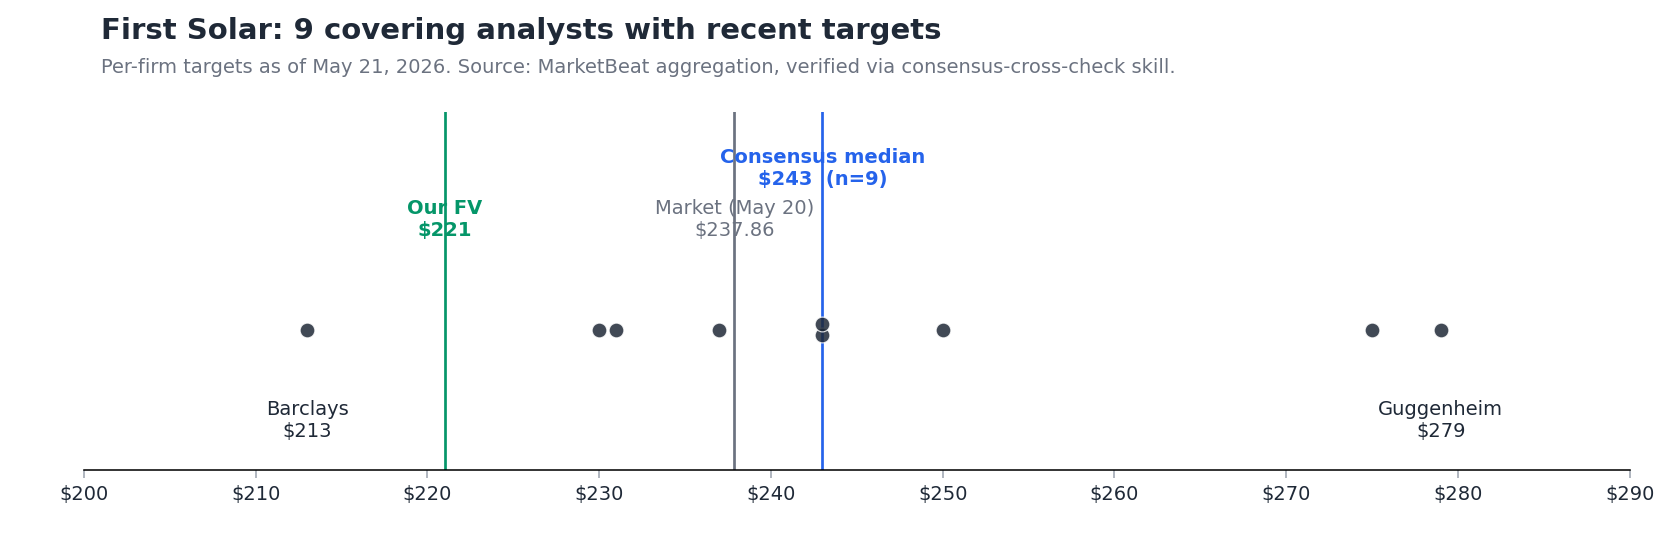
Our consensus-cross-check skill pulled the per-firm targets for the 9 covering analysts who currently publish a numeric target dated within the last six weeks. There are no stale tails to discount; the central tendency is built from genuinely recent coverage.
The headline numbers: - Median target: $243 — 2.2% above the May 20 close of $237.86 - Range: $213–$279 — span of 27% of median - Our dcf-multistage FV ($221) sits at the bear end of the cloud, 9% below the consensus median; only one analyst (Barclays $213) is below us
Three observations matter for the thesis:
First, the analyst community is roughly aligned with the market. Median $243 versus market $237.86 is a $5 disagreement — a typical sell-side 2% positive bias, not a strong directional call.
Second, our model is at the bear end of the analyst distribution, but not the unmodeled tail. Our $221 sits between Barclays $213 and Morgan Stanley $230. We are agreeing with the more cautious sell-side anchors that the base-case math doesn't quite support the consensus median, driven mainly by the conservative tax pin (21% statutory rather than the IRA-effective 5%) and the receivable-driven NWC drag from FSLR's current decision to hold rather than monetize 45X credits. The real bear case — a 45X policy cut — walks the model down to roughly $130-$150, below the lowest analyst target on the board. The policy bear case is not in the dispersion; it lives in the unmodeled tail of every analyst's distribution and ours.
Third, the bull side is supported but narrow. Argus ($275, May 13) and Guggenheim ($279, May 21, updated today) anchor the right side of the distribution. If you believe in pillar 2 plus a post-2032 successor program, you have institutional company. Whether that's correct is a separate question.
Where the subjectivity lives
Four judgment calls in the model are the right place to push back if you disagree.
Terminal growth of 3.0% from FSLR's SEC supplemental rather than 3.5% from a generic sector resolver. The agent extracted 3.0% from First Solar's own supplemental SEC disclosures. The generic cap_resolver would have applied 3.5% across all our names — a slightly bullish anchor. The agent picked the FSLR-specific evidence, the more conservative of the two. Reading the published sensitivity grid, switching to 3.5% lifts FV from $221 to roughly $227 — a small move because the post-2032 step-down already constrains how much terminal can carry.
Beta = 1.37 (Damodaran Semi Equipment) rather than a regression beta. A 60-month regression beta on FSLR would absorb IRA-driven outperformance as alpha, suppressing the estimated systematic risk and dropping WACC by 100+ basis points. We refuse to pay ourselves with that alpha; the Damodaran industry beta is what the structural risk of a US-domestic clean-energy manufacturer actually looks like. Worth knowing: a regression beta closer to 1.0 would lift FV by roughly $15-20.
Capex normalized at 11.15% of revenue (D&A × 1.1 proxy) rather than 7% maintenance or 16.7% TTM. TTM capex of 16.7% reflects the mid-build of the South Carolina facility, not steady-state. The agent's growth-asset ratio came out at 0.64 — above the SKILL's 0.5 threshold for the D&A proxy — so the model did not normalize all the way down to a pure 7% maintenance benchmark. Instead, it landed at a conservative middle ground (D&A × 1.1 = 11.15%). Carrying full TTM 16.7% through the projection would drop FV by roughly $15-20 toward $200; running pure-maintenance 7% would lift it by a similar amount toward $240.
Tax rate pinned at 21% federal statutory rather than the ~5% empirical effective rate. The DCF skill applies a single tax rate to all projected years; it cannot split the IRA-credit-driven low effective rate in the explicit period from a normalized rate in terminal. The agent chose 21% statutory across all years — the right conservative pin. Carrying the 5% effective rate into terminal would lift FV substantially but contradict the post-2032 cliff thesis, which is the whole point of the cliff. Bead autoanalystagent-8gqi tracks phase-dependent tax rates as a skill-architecture follow-up; until that lands, the conservative single-rate choice is the honest one.
What to watch over the next six months
In priority order, with our scoring rubric for each:
-
July 4, 2026 — customer-side 48E/45Y construction commencement deadline. Biggest single demand-side event. The directly observable signal is FSLR's Q2 2026 backlog print (late July). If contracted backlog grows materially through Q2 — utility developers pulling forward to qualify — pillar 2 strengthens regardless of policy noise. If backlog is flat or shrinks, demand is already in the slowdown the policy was designed to produce.
-
Q2 2026 earnings — late July 2026. Does FY26 guidance ($2.10–$2.19B 45X credits, $2.6–$2.8B adj EBITDA) hold? Does the no-2026-monetization stance hold or does the company opportunistically sell credits in 2H? Either way, the cash-flow geometry of the year changes.
-
Section 232 polysilicon investigation outcome — Commerce Department. If ruled in favor of restrictions, FSLR's domestic-pricing premium widens. Material upside not in our model.
-
TOPCon ITC ruling — USITC. Exclusion orders against crystalline-silicon imports would be a direct positive for FSLR's competitive position. Asymmetric upside.
-
FEOC rule implementation guidance — Treasury. Specifically, how "material assistance" is interpreted as applied to the CdTe/tellurium supply chain. A narrow interpretation is bullish (FSLR clearly qualifies). A broad one introduces 45X qualification risk we have not modeled.
-
2026 45X credit monetization decision — Q3/Q4. First Solar said "no 2026 Section 45X tax credit sales" at Q1. If that holds, the receivable balloons to $2+ billion by year-end and operating cash flow lags revenue meaningfully. If they pivot and sell credits mid-year, the cash-flow timing changes but the value does not.
We are pre-committing to score them — pass/fail per item — when each lands.
Why we are not taking a position
Our fair value is $221, roughly 7% below the May 20 close of $237.86 and 9% below the consensus median $243. Neither gap is large enough to act on. The structure of the bet is binary: if 45X holds and FSLR delivers, the model walks up toward the bull anchors ($275-$279 from Argus and Guggenheim) and you have meaningful upside; if 45X is accelerated to a wind-style termination, the model walks down past Barclays' $213 and the entire analyst range moves with it. The driver in both directions is policy — Section 45X — which is not a domain in which we have an informational edge. A 7% gap on the wrong side of the dominant driver is exactly the position size we'd rather not own.
Strip the business down
The last question we always ask is: how much of the model do you have to believe to justify the current price?
| What you have to believe | Per share | vs $237.86 market | Analyst coverage |
|---|---|---|---|
| 45X cut on accelerated schedule (unmodeled tail) | ≈$140 | −$98 (−41%) | no analyst here |
| Pillar 2 only — operational delivery, 45X gone after 2027 | ≈$185 | −$53 (−22%) | below Barclays $213 |
| Both pillars + IRA schedule preserved (our base case) | $221 | −$17 (−7%) | Barclays $213, Morgan Stanley $230, HSBC $231, BMO $237 |
| Both pillars + bull-case successor program | ≈$275 | +$37 (+16%) | Argus $275, Guggenheim $279 |
Two things to notice in this table.
The market at $237.86 sits above row 3 — paying more than "both pillars preserved." The price is roughly in line with the analyst consensus median $243, which sits between rows 3 and 4. The market and the analyst community together are pricing partial credit for a post-2032 successor program — the row-4 thesis at a heavily discounted weight. Our model declines to price that credit at all, which is why we land at row 3 rather than between 3 and 4.
The first row — 45X cut — is not in any analyst's forecast. That is the row where the dollar move is the largest, where no covering firm has priced the outcome, and where the policy catalyst (July 4 safe harbor; subsequent Treasury enforcement decisions) actually sits within a six-month window. The interesting question is whether you have a view on the probability of row 1 that the analyst community and the market do not.