HBAN at $15.51: Buying a Super-Regional Bank at Book
Huntington Bancshares trades at $15.51 against $16.05 book value. Three valuation methods converge near $20. The trade is six quarters of disciplined operating delivery against a raised 18-19% ROTCE guide, with rate sensitivity and CRE exposure that disclosure tells us are not load-bearing.
By Bobak Farzin
When we published this, our model used Huntington's balance sheet from its 2025 annual report (10-K). That filing predates Huntington's acquisition of Cadence Bank, which closed February 1, 2026 — an all-stock deal that took the share count from roughly 1.58 billion to about 2.03 billion and brought a larger, more goodwill-heavy balance sheet onto the books. We've updated the model to the post-merger Q1 2026 quarterly report (10-Q).
What it changes — not much:
| Before | After | |
|---|---|---|
| Book value per share | $16.46 | $16.05 |
| Tangible book per share | $11.89 | $10.50 |
| Residual income | $21.27 | $19.48 |
| Justified P/B | $20.88 | $21.63 |
| Consensus target | $20.00 | $19.25 |
The conclusion holds. All three methods still land near $20 a share, and at today's ~$16.36 the stock still trades at about book value. The thesis — paying about book for a franchise earning near its cost of capital, with operating-leverage upside as the Cadence integration plays out — is unchanged. The error moved the fair-value estimate by about a dollar but did not change our call on value.
Huntington Bancshares trades at $15.51 against $16.05 of book value per share. The market is essentially pricing the franchise at zero — paying for the existing book and nothing for the earnings stream the book produces. Our residual-income model puts fair value near $20, and two independent methods land in the same neighborhood. The trade is six quarters of operational delivery against a raised 18-19% ROTCE guide.
We do not need HBAN to hit 19%. We need them to keep doing what they have done through the cycle — earn roughly 14% on tangible common equity, modestly above their cost of equity, in line with the 10-year realized average. The 18-19% target is upside the model does not require.
On pricing. This post was published over the weekend of May 16–17, 2026. Our reference market price is Friday's close ($15.51 on May 15). The model-portfolio entry executed at the Tuesday May 19 pre-market quote ($15.57) — the first available transactable price after publication. No earnings print is imminent; Q2 2026 reports mid-July.
The build
  Book value per share                              $16.05
  + PV of explicit-period excess returns             +$0.80
  + PV of fade-period excess returns                 +$0.75
  + PV of terminal residual income                   +$1.89
                                                    ───────
  Residual-income fair value                        $19.48

  Cross-method confirmation
  ───────────────────────────────────────────────────────
  Justified P/B                                     $21.63
  Consensus target median (10 analysts)             $19.25
  Method spread (max − min) / min                  12%
Three valuation methods land near $20. That is unusual — across the nine super-regional banks we screened, the median method-spread is about 35%; HBAN's ~12% spread is among the tightest in the cohort. The interpretation is not that our model is "right" in some absolute sense; it is that the answer does not depend much on method choice. Whether you anchor on residual income, on justified price-to-book, or on what ten sell-side analysts have published as their median, you land on a price roughly 30% above where the stock trades today.
Why residual income for HBAN
A bank's earnings depend on the interplay between return on equity, cost of equity, and the equity base. The residual-income framework values that interplay directly: fair value equals book value plus the present value of every year of excess returns the franchise earns above the cost of that capital, fading to a terminal level. For banks where book value is meaningful and stable (HBAN's tangible book has grown at 9.4% YoY through 2025), this is the right shape.
The model uses HBAN's realized 10-year mean GAAP ROTCE of 13.97% as the through-cycle anchor — not management's 18-19% aspiration. Management's target is upside; the realized mean is the conservative base. The window spans 2016-2025, which includes 2020 COVID provisioning (ROTCE dropped to 8.2%), the 2022-2024 rate-hike NIM expansion (ROTCE peaked at 18.1% in 2022), and a 2025 normalization (14.2%). That cycle-mean is the load-bearing input.
Terminal ROE = 13.97% × HBAN's tangible-equity ratio of 0.65 = 9.1%, modestly above the 7.66% cost of equity. The 1.5-percentage-point spread compounds across a level perpetuity (HBAN is a Regional-Banks-classified franchise; we do not assume the excess return base grows). That spread, capitalized, is the $1.89 of terminal PV in the build above.
Rate sensitivity: small in either direction
HBAN discloses an asset-sensitive balance sheet: +0.9% NII on a +100bp parallel shock, −0.6% on a −100bp shock (2025 10-K Item 7, ramp scenario, 12-month horizon). On annual NII of approximately $5.3B, that is roughly ±$30-50M per 100bp — about $0.02 of EPS per 100bp move. Capitalized at our 7.66% cost of equity, the fair-value impact is on the order of $0.20-0.30 per share per 100bp.
For context, the regression of HBAN's annual ROTCE against the 10-year Treasury yield over 2016-2025 produces a slope of +1.69 (r = +0.65). That looks dramatic but it captures pre-hedge historical correlation. HBAN's current $44B of receive-fixed swaps plus purchased floor spreads makes the forward sensitivity much smaller. We rely on the management disclosure, not the regression, for the live exposure.
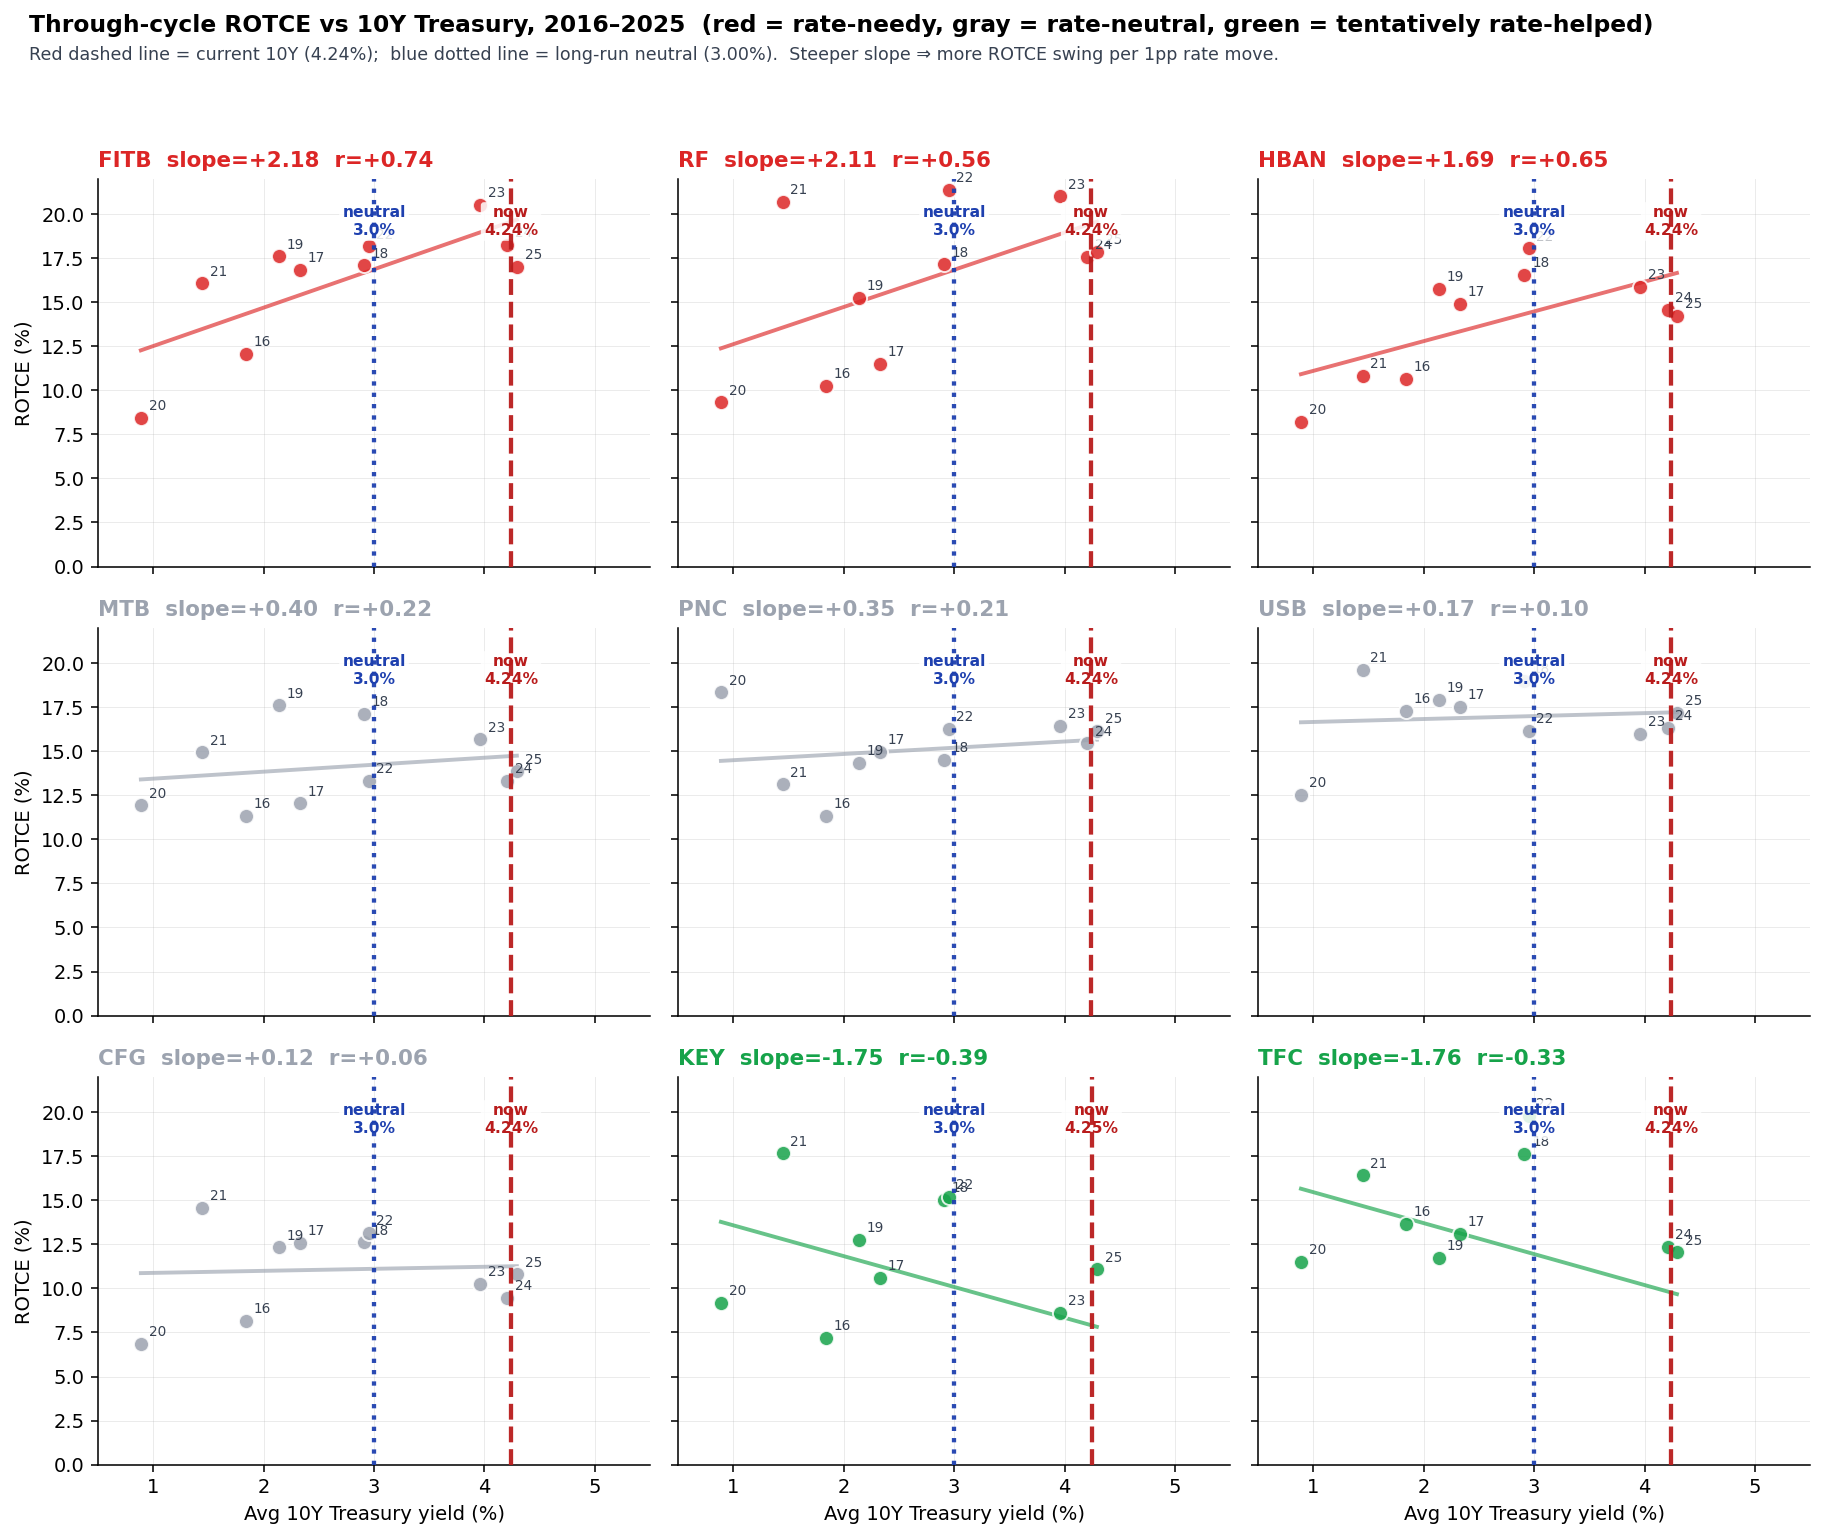
The chart above plots each of nine super-regional banks' annual ROTCE against the average 10-year Treasury yield in that year. HBAN sits in the upper-left panel: the historical regression looks steep, but the dashed line (current 10Y rate) is far from the dotted line (long-run neutral 3.00%), and the post-2024 disclosed hedging program is what now governs forward NII rather than the pre-hedge regression.
The disclosed exposure is small enough that even a Fed cutting cycle two hundred basis points faster than the market currently expects moves fair value by less than $1. This is not a load-bearing risk.
Commercial real estate exposure is well below cohort
HBAN's commercial real estate is 10.2% of total loans, with office at 1.2%. Both numbers sit below the nine-bank super-regional cohort median of approximately 15-17%. The industry-level CRE maturity wall — $875-936B in 2026 and a peak $1.26T in 2027 — is a real macro overhang, but it disproportionately threatens the CRE-specialist banks (Bank OZK 70%, Webster 37%, Valley National 50%) rather than HBAN.
HBAN's own allowance for credit losses on CRE covers approximately 1.83% of the CRE book. Through-cycle net charge-off rates have run 25-30 basis points quarterly. Neither indicates the franchise is under-reserved against the maturity wall.
What "on track" looks like quarter by quarter
The thesis hinges on operational delivery across the next six quarterly prints. We score each one against pre-committed checkpoints:
| Quarter | Reports | What "on track" means |
|---|---|---|
| Q2 2026 | mid-July | NIM 3.27-3.30%, expense ratio 58-59%, Cadence conversion on track for June close. NCO 25-30bp. |
| Q3 2026 | mid-October | First clean post-Cadence quarter. NIM holds. No integration-driven expense spike. Loan growth at or above 1% QoQ. |
| Q4 2026 | mid-January 2027 | Efficiency ratio 54% low-to-mid. ROTCE pacing toward 17-18%. Full run-rate synergies in the P&L. |
| Q1 2027 | mid-April 2027 | EPS pacing for $1.90+ full year. NIM in mid 330s. |
| Q2 2027 | mid-July 2027 | 18-19% ROTCE in print, not as a forward guide. |
The Q4 2026 efficiency ratio is the single most informative checkpoint. Management has guided to a 54% low-to-mid range, an improvement from the current high-50s. If that number prints above 56%, the synergy story is failing and we should reassess. If it lands in the guide, the path to 2027 EPS of $1.90-$1.93 is intact and the franchise re-rates.
What would make us wrong
Four named triggers, each with a pre-committed consequence. The list is short on purpose: each item maps to one load-bearing claim (cost discipline, NIM trajectory, terminal earnings, credit quality).
-
Q4 2026 efficiency ratio above 56%. Management guided 54% low-to-mid. A print above 56% means the Cadence/Veritex synergy story is failing in the P&L, not on slide decks. Trim the position.
-
Full-year 2026 NIM below 3.20%. Management revised 2026 NIM guidance down on the Q1 call — from prior "mid 330s" to a new "high 320s" — citing the faster Fed rate-cut path. A print below 3.20% means the rate-cut bite is materially worse than priced and the operating leverage isn't enough to compensate. Reassess the terminal ROE assumption.
-
2027 EPS prints below $1.90. Direct miss of management's own explicit guide ($1.90-$1.93 from the Q1 2026 call). The 2026 NIM revision is acceptable as long as the 2027 ROTCE delivery still lands; this is the bottom-line test. Thesis broken; close.
-
Quarterly NCO ratio above 35bps for two consecutive quarters. Credit cycle bite, likely concentrated in CRE or multifamily. Through-cycle has been 25-30bps; sustained above 35 indicates structural deterioration in the loan book. Reassess CRE exposure and likely trim.
These are the things we will score against each print, not hand-wavy hedges. The Q4 2026 efficiency ratio is the single most informative checkpoint — it arrives mid-January 2027 and tells us whether the operating leverage that underpins the 2027 EPS guide is real.
Portfolio action
4% initial position at T+1 close (Tuesday, May 19). Target total weight is 6%, accumulated over the next one to two quarters at favorable prices.
The 4% initial sizing reflects high methodological conviction (three-method ~12% spread) tempered by medium operational conviction (the synergy delivery requires six quarters of execution we cannot front-run). The 6% total cap is our highest single-name weight in the regional-bank cohort — HBAN earns it because the asymmetry is unusually clean: limited downside (book floor near current price) against ~30% upside to the three-method midpoint. Legging from 4% to 6% lets us improve average cost if the market trades us a better price; we expect to add on weakness or on continued operational confirmation, whichever arrives first.
Hold until either method-convergent fair value reached ($19-22 range) or any of the four falsifiers triggers.
Margin of safety
HBAN trades at $15.51 versus a book value of $16.05 per share. That is the unusual feature of this trade: the entry price is essentially the existing book. If our entire forward thesis is wrong — if HBAN never delivers another point of operating leverage, never realizes the Cadence/Veritex synergies, never improves its delivery ratio from 75% — the franchise is still earning roughly its cost of capital today and producing $10.50 of tangible book per share.
A broken-delivery story typically trades at 0.85-0.90× book for super-regional banks. On HBAN's $16.05 book, that implies a floor of about $14, or about 10% below current. The downside is real, not zero, and we should not pretend otherwise. But the asymmetry favors the trade: roughly 30% upside to the method-convergent ~$20, against roughly 10% downside if the franchise stagnates.
A dividend of $0.62 per share annualized — 4.0% yield — funds the wait.
The strip-down: at $15.51 you are paying for the existing book of business. The model says you are also getting a $4-5 call option on whether management can deliver on the operating plan they have already announced. Six quarterly prints will tell us whether we collect that option.
Model portfolio update
The call above is reflected in our live model portfolio.
Full event history and methodology: /blog/portfolio