What's a Company Worth? Apple, the iPhone, and the Answer Key
On June 29, 2007 the first iPhone went on sale, and you could have bought all of Apple for $92 billion. We now know exactly how much cash the company went on to produce — and the answer key says that on launch day, the market was pricing the iPhone itself at roughly zero. Grading that price is the clearest way we know to show what a valuation is, and what it isn't.
By Bobak Farzin
What's a company worth? It is worth all the cash it will ever hand its owners, counted in today's money. Sounds simple, but it can be harder to compute than you might think — and in recent history we have a pretty dramatic example to see why, with a very specific timeline. Apple.
On the morning of June 29, 2007, people were camped outside Apple stores. The first iPhone went on sale at 6 p.m. that day, and the question on the news was whether a $499 phone without a keyboard could possibly sell. Would it be like the Newton, Apple's personal digital assistant, that was a flop? Or would it take over, like the Nokia phones that dominated at the time? What would you even do with a computer in your pocket? Those questions were being asked in earnest, and serious people mostly saw a Newton:
"We've learned and struggled for a few years here figuring out how to make a decent phone. PC guys are not going to just figure this out. They're not going to just walk in." — Ed Colligan, CEO of Palm, November 2006
"iPhone sales will be unspectacular... iPhone may well become Apple's next Newton." — David Haskin, Computerworld, February 2007
"There's no chance that the iPhone is going to get any significant market share. No chance." — Steve Ballmer, CEO of Microsoft, April 2007
Even Apple wasn't predicting what actually happened. Steve Jobs's stated goal was 10 million phones by the end of 2008, about 1% of the mobile phone market. In 2025 alone, the iPhone brought in $210 billion of revenue.
On that day you could have bought the entirety of Apple — every store, the iPod business, the Mac business, and whatever the iPhone was about to become — for about $92 billion. (Headlines would have said $105 billion. That is the market capitalization, the share price times all the shares. But if you paid $105 billion for the shares, you would find $13 billion of cash sitting in Apple's own bank accounts, instantly yours, so the business itself really cost you $92 billion. That net-of-cash number is called the enterprise value and it is the one we will use throughout. We also won't talk about per-share prices here, because of Apple's many stock splits over these years — but you can always get a stock price by dividing the company's value by the share count.)
Was that a lot or a little? What would have been fair as a price at that time? Here we discuss the machine investors use to answer that question — a discounted cash flow, or DCF. The machine has two inputs: the cash a company will produce, and a discount for having to wait for it. The first input is the hard one, because it lives in the future. But nineteen years have passed, and the future happened. We have the answer key, and we can grade the price in 2007.
The whole idea in two steps
Step one: a company is worth the cash it will hand its owners. Not the factories, the patents, or the revenue — the cash. Every year a company sells things, pays its costs, and spends what it must to keep its equipment and buildings current. Whatever is left is called free cash flow: money that could be handed to the people who own the place, as dividends, as stock buybacks, or re-invested in the business on their behalf.
Step two: cash today is worth more than cash in the future, so we must discount the cash we will get later. That is what interest and compounding are all about. The mechanics are one division: at a 10.2% discount rate, $100 arriving next year is worth $100 ÷ 1.102 ≈ $91 today — its present value. Divide again for each further year of waiting: $100 arriving in ten years is worth about $38 today, and in twenty years, about $14. Keep that $14 in mind; it explains a surprise later. The general equation is
present value = casht ÷ (1 + r)t
where r is the discount rate and t is the number of years you wait for that cash. Our three examples are just r = 10.2% with t = 1, 10, and 20. Notice the fraction doing the work: the future cash is the numerator, and the waiting and the risk sit in the denominator — two words that come back at the end.
Where does the discount rate in the denominator come from? In 2007, safe US government bonds paid a guaranteed 5% per year, and Apple was far from safe at that time. Nobody accepts a "maybe" when a guarantee pays the same, so you demand more — for a company of Apple's riskiness, a fair demand was about 10%. (Professionals estimate this with formulas and call it the weighted average cost of capital, or WACC. The logic underneath is impatience plus risk.) We will run everything at 10.2%, and later you can turn that dial yourself and see how much the exact choice matters.
That's the whole machine: write down every year of future free cash flow, divide each one down to today's money, add them up. The challenge is not the discount rate. It is the future cashflows, which are entirely uncertain. If the iPhone had been a flop, those hoped-for cashflows would have quickly gone to zero — that is exactly the future the experts above were predicting. It was a dramatic success instead, so we can go back and run the valuation with perfect foresight.
The answer key
Public companies are required to file their financial statements with the SEC every quarter, with a full audit every year. Apple is no exception, so we can go back and look up these free cash flow values from the past. Add them up over 18 fiscal years from 2008 through 2025 and you get $1.10 trillion — twelve times what the whole company sold for on launch day, before any discounting. (Apple's fiscal years end in late September, so "fiscal 2008" runs roughly October 2007 through September 2008: the iPhone's first full year on sale.)
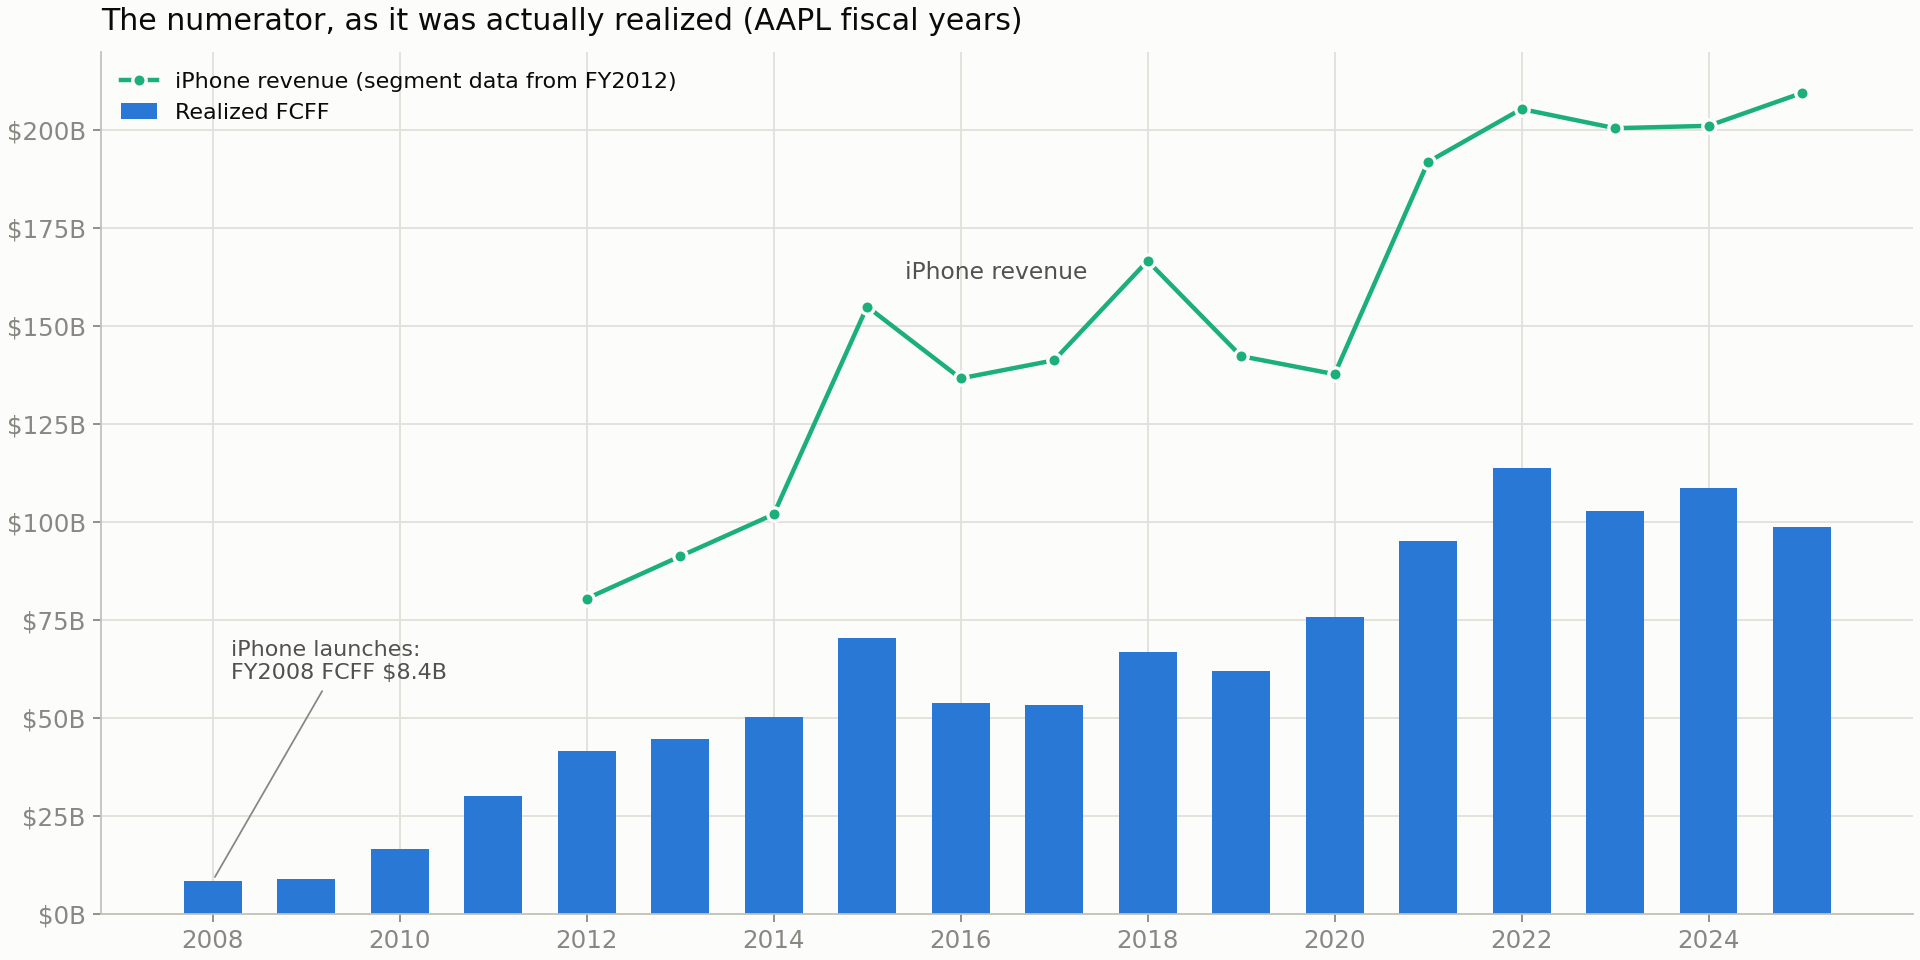
The chart shows the ramp: $8 billion in fiscal 2008, $17 billion by 2010, $114 billion at the 2022 peak. The overlaid line is iPhone revenue, which Apple began reporting separately in 2012. One honest caveat: the reports attribute revenue to the iPhone but not profit, so all of our math is for the whole company, iPod and Mac included. The iPhone line is there to show what did the heavy lifting.
Running the numbers with the answer key open
Now the experiment. Stand in June 2007, armed with the actual future, and feed the machine every dollar now on the record: those 18 fiscal years, plus the two further quarters Apple has reported since (through March 2026). Discount at 10.2%. Two rules keep it honest.
Rule one: no peeking at prices. We are not looking ahead to the market prices here. We are not asking for analysts' predictions. No market price after June 29, 2007 enters the math — only the cash Apple actually produced, and the discount rate you could have estimated that day. (Why keep charging 10.2% for risk when we secretly know how it turned out? Because we are grading the 2007 buyer, and the 2007 buyer didn't know.)
Rule two: assume the story ends boringly. Where the records stop, we refuse to assume any more success. From there on we treat Apple's cash as simply growing 2.5% per year forever — a moderate rate that says nothing special ever happens again. There is a one-line formula for valuing a steady stream like that (it is called the Gordon growth model): divide next year's cash by the gap between your discount rate and the growth rate. At our settings the gap is 10.2% − 2.5% = 7.7%, and dividing by 0.077 is the same as multiplying by about 13. A steady, slowly-growing stream is worth about 13 years of its cash.
Run the machine. The $1.10 trillion of raw cash shrinks to a present value of $392 billion — discounting at 10.2% ate roughly two-thirds of it. That number gives zero credit to anything beyond the recorded quarters, as if Apple then simply stops. So if we had magically known that the success would be exactly as it was, we could have bought on June 29th, 2007 and known we had a 4x profit in our hands. The world does not work that way — we can't know the future — but if it did, that is the floor: 4.3 times the price.
Adding in the boring ending — the 2.5%-forever tail — brings the value to $615 billion, or 6.7 times the price in 2007.
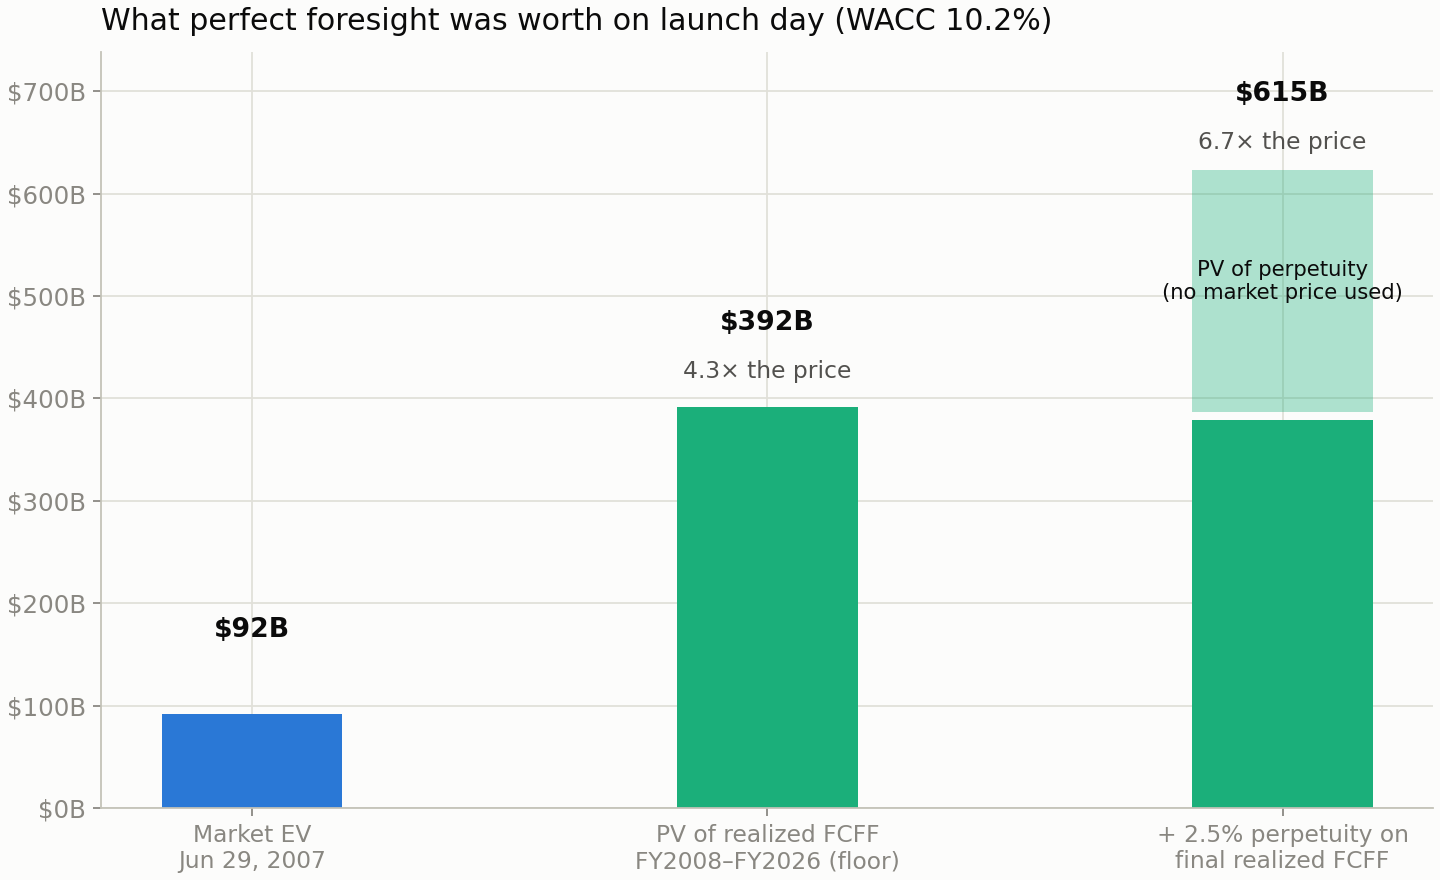
That is the scorecard: at minimum a 4x deal, in any reasonable reading closer to 7x — knowable on launch day only if you knew the cash flows. The next question becomes: how far out did you really need to predict the cashflows?
How far did you need to see?
Did you need to predict all 18 years of cashflows? That would seem like a lot! Suppose instead that in June 2007 you could see only the next N years of real results, and past that you assumed the same boring 2.5%-forever ending. How many years of sight did you need to justify the price?
The answer is one year.
Apple's free cash flow in fiscal 2008 was $8.4 billion — up from $4.5 billion the year before on the strength of the Mac and iPod; the iPhone was still only a sliver of revenue. Do the boring-ending math on just that one year: $8.4 billion × 13 ≈ $112 billion of tail value at the end of fiscal 2008. Add the year's own cash, pull it all back to 2007 money, and you get $107 billion. More than the $92 billion price on that day.
That tells you something startling about launch day: the market wasn't paying for the iPhone. The price barely covered the company Apple already was. The product that would power a trillion dollars of cash was priced, that afternoon, at roughly zero.
Each additional year of sight buys the iPhone's actual ramp:
| Years of foresight | Sees through | Value in 2007 | vs the $92B price |
|---|---|---|---|
| 1 | fiscal 2008 | $107B | 1.2x |
| 2 | fiscal 2009 | $111B | 1.2x |
| 3 | fiscal 2010 | $189B | 2.1x |
| 4 | fiscal 2011 | $315B | 3.4x |
| 5 | fiscal 2012 | $407B | 4.4x |
| 8 | fiscal 2015 | $581B | 6.3x |
| 15 | fiscal 2022 | $666B | 7.2x |
| 18 | fiscal 2025 | $604B | 6.6x |
Four years of sight — through fiscal 2011 — already triples the price. By eight years you have seen nearly everything; the ladder mostly flattens after that. Careful readers will notice two oddities in the bottom rows: fifteen years of sight "beats" eighteen, and the 18-year row shows $604 billion rather than the $615 billion from the last section. Both have the same cause. Each ladder row, to stay simple, treats its final year as the forever base, while the full model smooths the base over the last three years. Fiscal 2022 was a blockbuster that flatters the tail; fiscal 2025 was softer than the three-year average. Real data wiggles.
Drag the slider and watch the value grow as you are allowed to see more of the future:
How far into the future could you see?
Into the model details: What are the dials?
We are assuming we know the true cashflows for a long period of time. Even so, there are still two dials we must set by judgment to turn those cashflows into a present value: the discount rate, and the perpetuity growth assumption.
The discount rate is at best an estimate — it is the demand you set for bearing the company's risk, and reasonable people disagreed. In 2007 you could have defended anything from 9.6% to 11.3%, and across that range the value swings from $680 billion down to $513 billion. A dial you cannot pin down to better than two percentage points moves the answer by nearly $170 billion. This is why honest valuations are ranges, not single numbers.
The growth dial is the surprise. Sweep it across its whole defensible range, 2% to 3%, and the value creeps from $600 billion to $633 billion. The dial that sounds most important — what happens forever after — barely matters. Two reasons, both visible in numbers you already have. First, the tail's dollars arrive so late that discounting has already shrunk them to about a third of the total value (remember the $14). Second, the perpetuity divides by the gap between the discount rate and growth, and moving that gap from 8.2 points to 7.2 points doesn't change a division by much. What happens far away matters little, because it is far away.
Play with the widget dials and do the math by hand to convince yourself of both facts:
The two dials every DCF has
When did the market figure this out?
How long did it take for the market price to catch up to what the future cashflows were worth? We can watch it happen, week by week, for nineteen years.
One note before the charts. The answer-key value is not one frozen number: as the years pass, cash already paid out leaves the model, and what remains is re-valued in that day's money. So the value line on these charts moves too — it shows what the remaining future was worth on each date, under the same no-peeking rules.
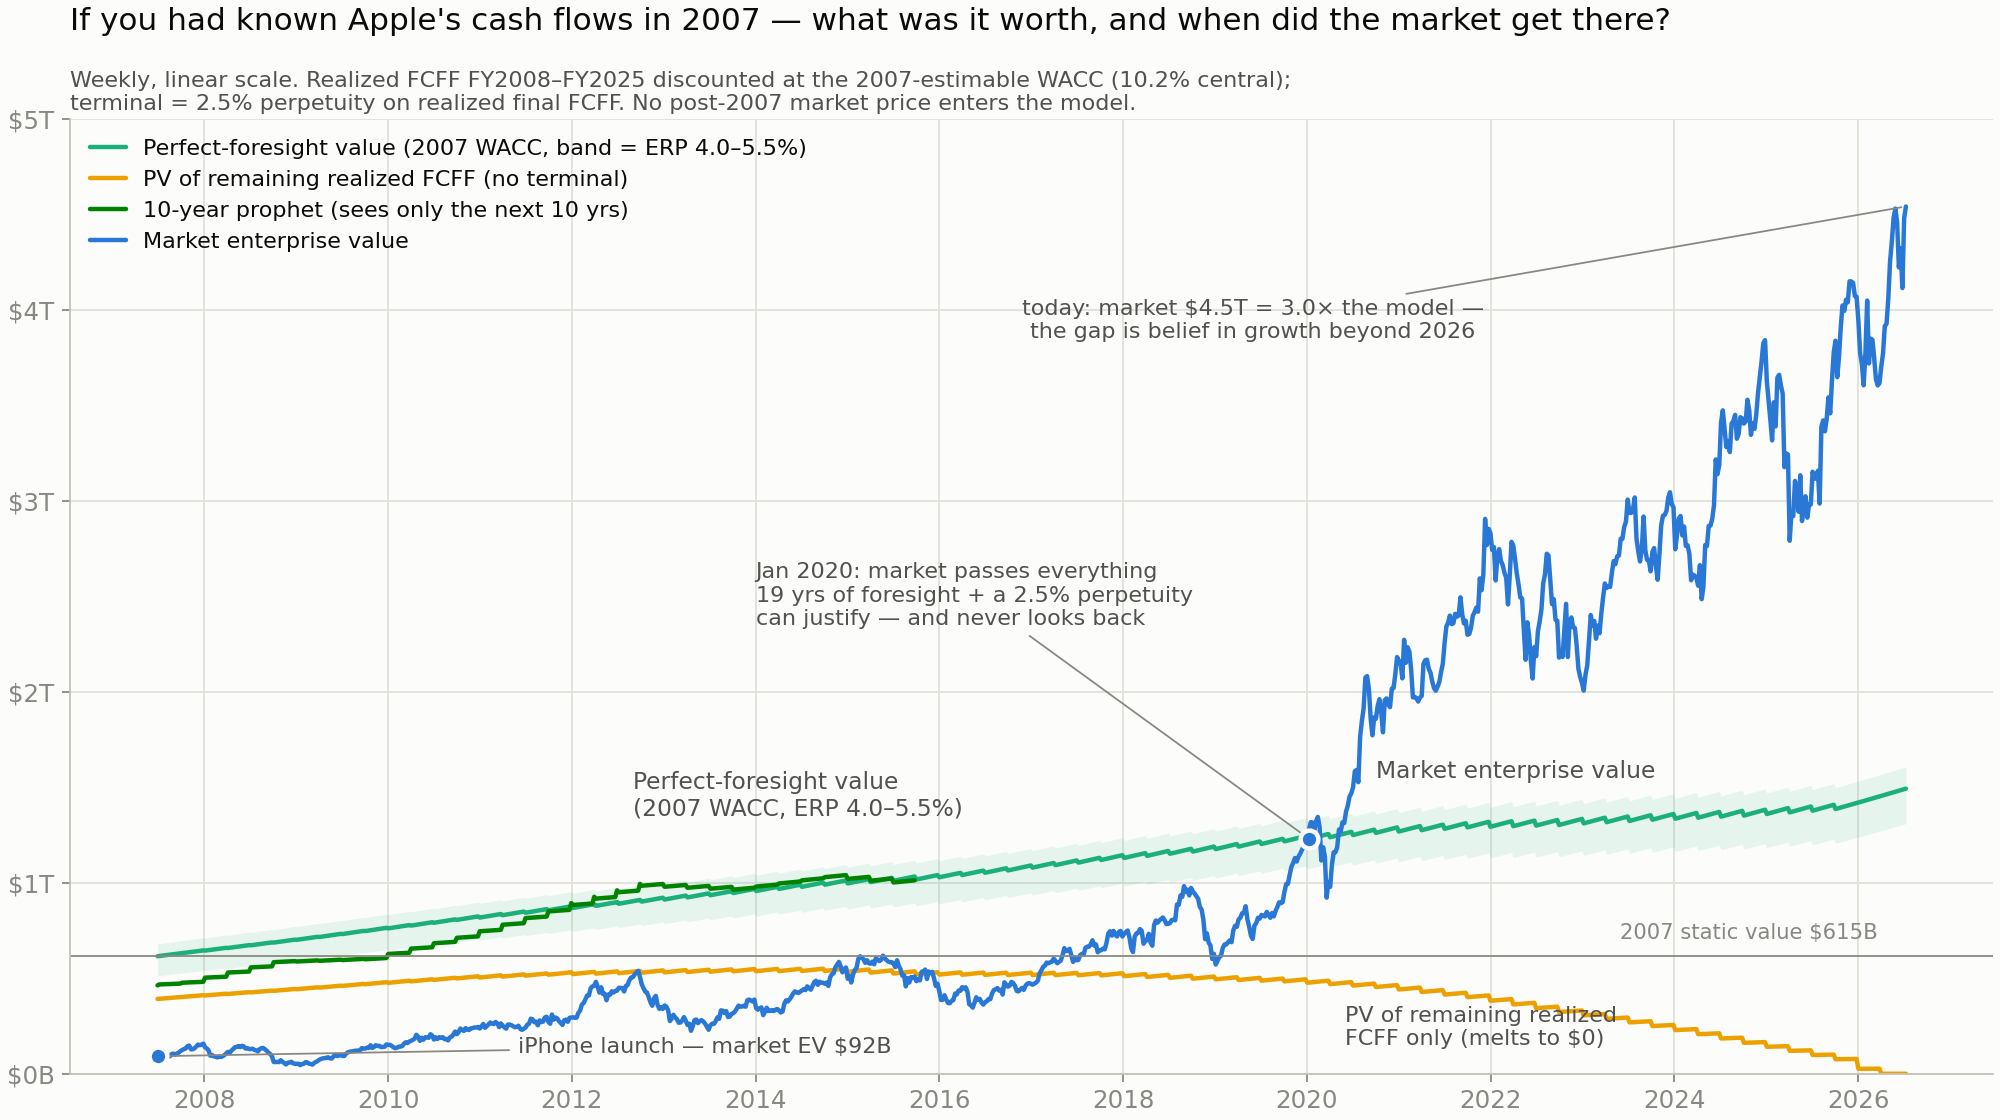
If we look at this linear plot, it appears to be an exponential! We just go up forever. But linear charts flatter big numbers: a move from $2 trillion to $3 trillion looks enormous, while the climb from $92 billion to $250 billion — nearly a tripling — is a flat smudge at the bottom. Put the y-axis on a logarithmic scale, where every equal vertical step is an equal percentage move, and we can see it was a bumpy ride:
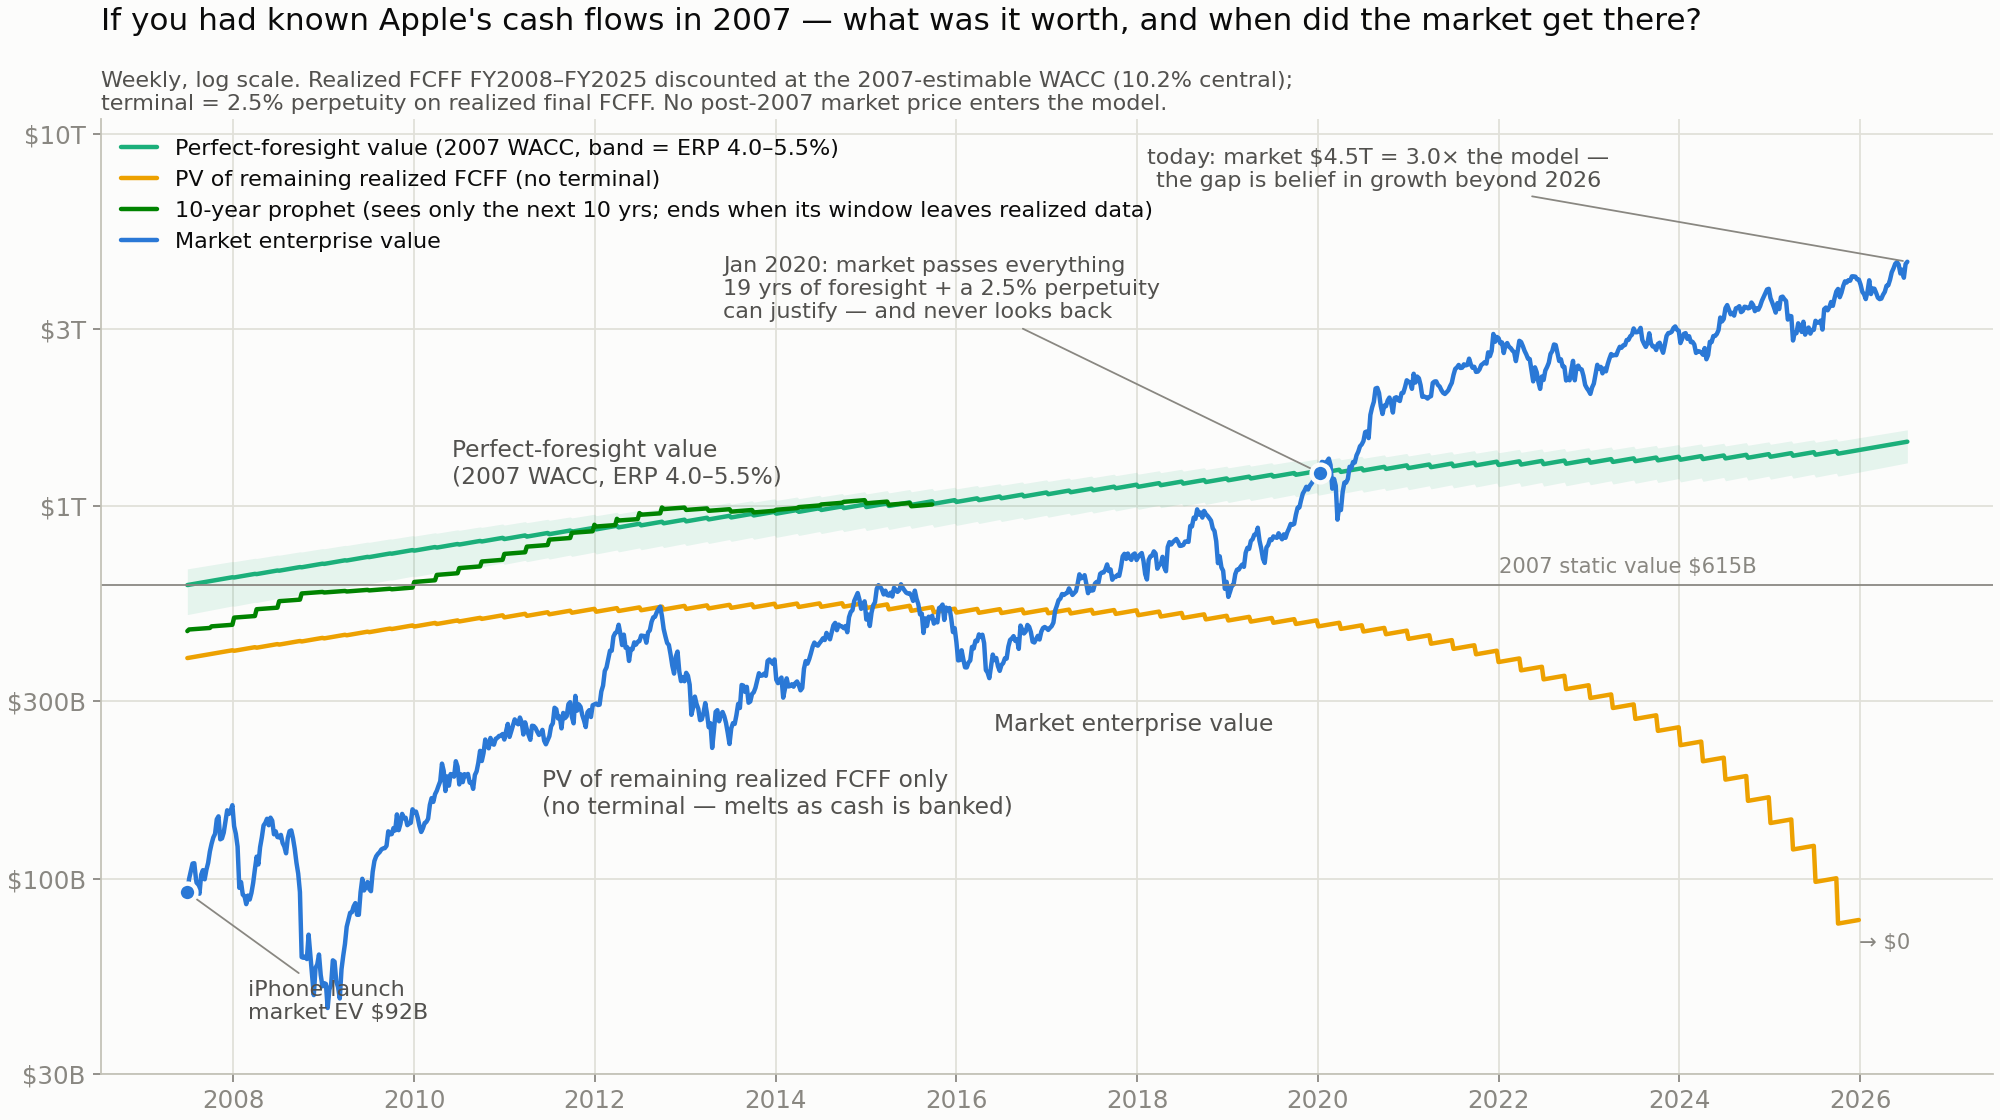
Three bumps are worth reading closely.
It took about ten years for the market to believe the launch-day verdict. The price first touched $615 billion in 2015, fell back, and only stayed above it from 2017 — a decade of blockbuster results, delivered in public, quarter after quarter, before the 2007 answer-key value became the everyday price.
Twice along the way, the market un-believed. In mid-2013, with six years of explosive growth already on the books, you could buy all of Apple for $247 billion (as always, that is the business net of its by-then-enormous cash pile) — while the cash it would in fact go on to produce was worth $543 billion in that day's money. The market was selling dollars of cash that were genuinely coming for 45 cents, because it feared the iPhone story was ending. The same doubt returned in 2016. "Is the iPhone over?" was a $300 billion question, twice.
Then in January 2020 the market crossed above everything the recorded cash plus the boring ending can justify, and it stayed there. Part of that surge was not about Apple at all: by late 2020 the 10-year government bond paid 0.66% instead of 5%, and when the safe alternative collapses, every discount rate falls with it — at those rates, the very same cashflows were "worth" over $2 trillion. Rates snapped back in 2022 and the price fell with them, but never back below the answer-key line. Even with a perfect numerator, the denominator never stands still.
Wrapping up
It is easy to stand here today, in 2026, and say that we all should have known the great success of the iPhone, and that the market should have jumped six-fold on launch day. The market was not foolish that day. It knew the future was uncertain — most new products fail, and the experts quoted at the top of this page were describing the most likely outcome, not being stupid. The people who owned Nokia and BlackBerry in 2007 lived this exact story with the sign flipped: dominant companies, confident futures, and a decade of cashflows that evaporated instead of compounding. The $92 billion was not an error; it was an average over possible futures, most of which did not contain a trillion dollars of cash. Apple drew its future from the far right tail — and we chose Apple for this essay because we know how it ended. The choosing is itself hindsight.
You never know the numerator. You watch and learn the numerator quarter by quarter as the performance rolls in — and that grinding, doubting line in the chart is what "the market figuring it out" looks like from the inside.
DCF is not telling you the future, and it is not telling you what a stock will do. Rather, it turns a belief about the future — cashflows and a discount rate — into a price today. That is how we use it in practice. We estimate the cashflows and the discount rate as carefully and honestly as we can, turn the crank, and compare our value to the market's price. Both of our inputs can be wrong — the numerator can be wrong, the denominator can be wrong — so a small gap between our value and the price means nothing. What we want is a value that sits far above the price, with enough room to be wrong on both dials and still come out ahead. That room is called a margin of safety, and only when we have it, with high confidence in the inputs, do we invest.
Then comes the part this whole essay was really about: waiting. Apple's price took ten years to catch up to the launch-day verdict, and the market un-believed twice along the way. If the cashflows arrive, the price follows them — on the market's clock, not ours.