GS at $1,061.23, MS at $214.48: The Best Year Ever, Priced Forever
Goldman and Morgan Stanley closed the week 35% to 40% above our deliberately generous through-the-cycle sum-of-the-parts. We compute what the prices require — record pools and peak margins held in perpetuity, plus a re-rating on top — and pre-commit to the October evidence that would prove the market right.
By Bobak Farzin
On pricing. Prices in this note are the Friday, July 24, 2026 closes — GS $1,061.23 and MS $214.48 — the snapshot our refreshed valuations reference. This post does not initiate a position, so there is no execution to document; if that changes, the model portfolio executes at the T+1 close per our standard convention.
It is a challenge to call a company overvalued. For many reasons, an analyst can miss future value drivers that can lead to cashflows. From the outside it is impossible to know what is in the pipeline. Even with that caveat, we believe that two premier franchises in investment banking are overvalued at today's prices.
At over $1,060 per share, Goldman (GS) and Morgan Stanley (MS) at $214 are priced far above a deliberately generous through-the-cycle valuation — our fair value sits 35% to 40% below Friday's closes. To get to the market price we would need to believe that the recent history will persist perpetually into the future: perpetual ROTE at the highest level ever and the 2026 trading and deal pools as the permanent baseline.
Goldman, in parts
Let's break down Goldman first and then take what we have learned to look at Morgan Stanley. Valuing a complex business requires breaking it down into parts that we can understand. We do this in several of our valuations and investment banks can be broken down similarly. At Goldman, the major segments are the investment bank — Goldman calls it Global Banking & Markets — and Asset & Wealth Management. The parent company holds excess capital and there is a Platform Solutions segment that is being wound down. We account for them, but they are not the major drivers.
| Goldman segment | What it is | Our value | Share of value |
|---|---|---|---|
| Global Banking & Markets | trading desks + M&A advisory + underwriting | $496.2/sh | 72% |
| Asset & Wealth Management | $3.3T of client assets at ~31bps + private bank | $166.4/sh | 24% |
| Platform Solutions | consumer platforms in wind-down | $9.8/sh | 1% |
| Parent excess capital | ~$14B earning roughly the risk-free rate | $21.4/sh | 3% |
| Fair value | $694 | vs market $1,061.23 |
A generous baseline, not a trough
Like any business, one thinks that the good times will persist forever and the bad times will never end. Rationally we know that not to be true, but it is still easy to fall into this trap. What we see in the current valuation is an extrapolation from the recent very strong revenue past into the perpetual future.
When we build from our SOTP, even being generous about the future and giving some persistence to the current trend, we cannot land on the market price. The arithmetic that can get us there requires some amazing things to happen. Could that be true in the coming months? Certainly yes. If equity volumes stay high, if deal flow stays high in the AI Capex Supercycle, the wealth management net new assets (NNA) exceed historical levels - then yes, we can get close to the current price being a fair valuation of the future. But this really does feel like a stretch. It is possible, but would require some exceptional things to continue for longer than seems likely.
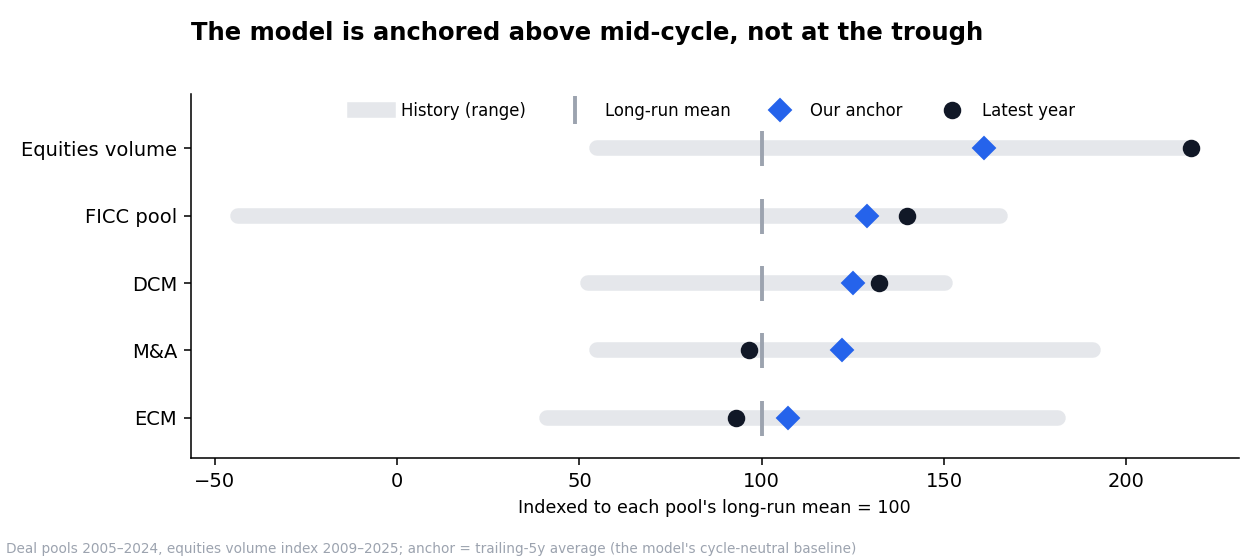
We are grounding our valuation in history and trying to be generous with our assumptions without being irrational. Every one of the industry pool dials is above its own long-run mean. If you look at equities volume and FICC pool you can see that there is quite a wide range of possible outcomes. It feels crazy to extrapolate from the all-time high into perpetuity for valuation; projecting the best possible time into the future forever. Yet even using the upper part of the cycle inputs gets us to only 2/3rds of the market price.
The build-up to the market price
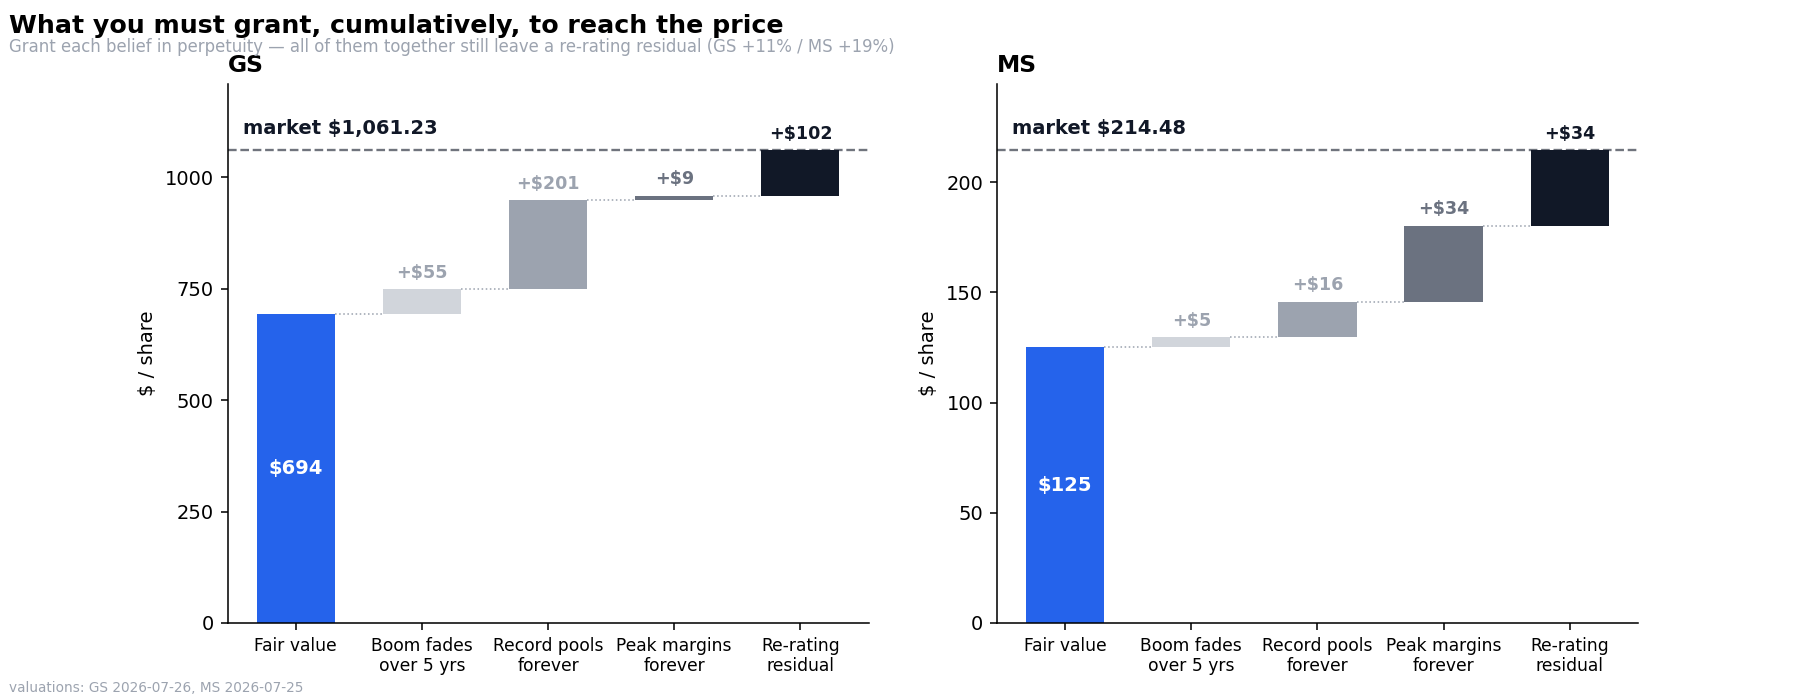
How can we build up this valuation from our core assumptions? For Goldman, we get to about $694 with our generous assumptions. Then we add a continued boom that fades over five years - that is worth another $55 per share. Then we hold the record pool level forever instead of letting it fade: another $201. Then we keep the peak margins too - for Goldman that adds just $9, because the margins are barely above their averages already. That is the most generous stack we can defend, and it lands at $959. We still have $102 per share that we cannot explain. And that last piece is not a cashflow at all - there is no revenue or margin assumption left to raise. It is a lower discount rate or faster perpetual growth, forever. A re-rating.
| The build-up (GS) | $/share |
|---|---|
| Fair value, through-the-cycle | $694 |
| + boom persists, fades over 5 years | +$55 |
| + record pools become the permanent baseline | +$201 |
| + peak margins permanent too | +$9 |
| = everything at the record, forever | $959 |
| Market price | $1,061.23 |
| Unexplained | +$102 |
Morgan Stanley
At Morgan Stanley, there are many things that are quite similar. They have a large investment banking business that is keyed off volumes and dealflow. They have a wealth management business and they have some residual capital. Like any good bank analyst, we can lever the tools we already have to build up with assumptions adjusted for that single name. The industry pools are the same for everyone - there is one global M&A wallet, one equities volume cycle. What changes per name is the firm's slice of it and the shape of the business that captures it. Goldman runs nearly twice the trading risk (a $90M average VaR against Morgan Stanley's $51M), captures more of the M&A wallet, and pays out less of each revenue dollar (a 27.5% comp ratio against 32.3%). The wealth businesses are near mirror images: Morgan Stanley earns 73 basis points on $2.6T of advisor-led client assets, while Goldman manages $3.3T of mostly institutional money at 31 basis points. Same machine, different gears.
| Morgan Stanley segment | What it is | Our value | Share of value |
|---|---|---|---|
| Institutional Securities | trading desks + advisory + underwriting | $54.6/sh | 44% |
| Wealth Management | $2.6T fee-based assets at ~73bps + deposits | $62.7/sh | 50% |
| Investment Management | $1.8T of managed assets at ~31bps | $5.0/sh | 4% |
| Parent excess capital | ~$10B earning roughly the risk-free rate | $2.9/sh | 2% |
| Fair value | $125 | vs market $214.48 |
Applying all we learned, we have an even bigger gap than for Goldman. And the shape of the gap is different: Goldman's premium is mostly a bet on the trading and deal pools, while Morgan Stanley's is mostly a bet on margins - we must believe that wealth management earns its current 30%+ pretax margin forever, above what it has averaged through the cycle. Grant it all - the pools, the margins, the record year as the permanent baseline - and we still cannot explain the last $34 per share: a further 19% re-rating on top of everything we granted.
What the price requires, in ROTCE terms
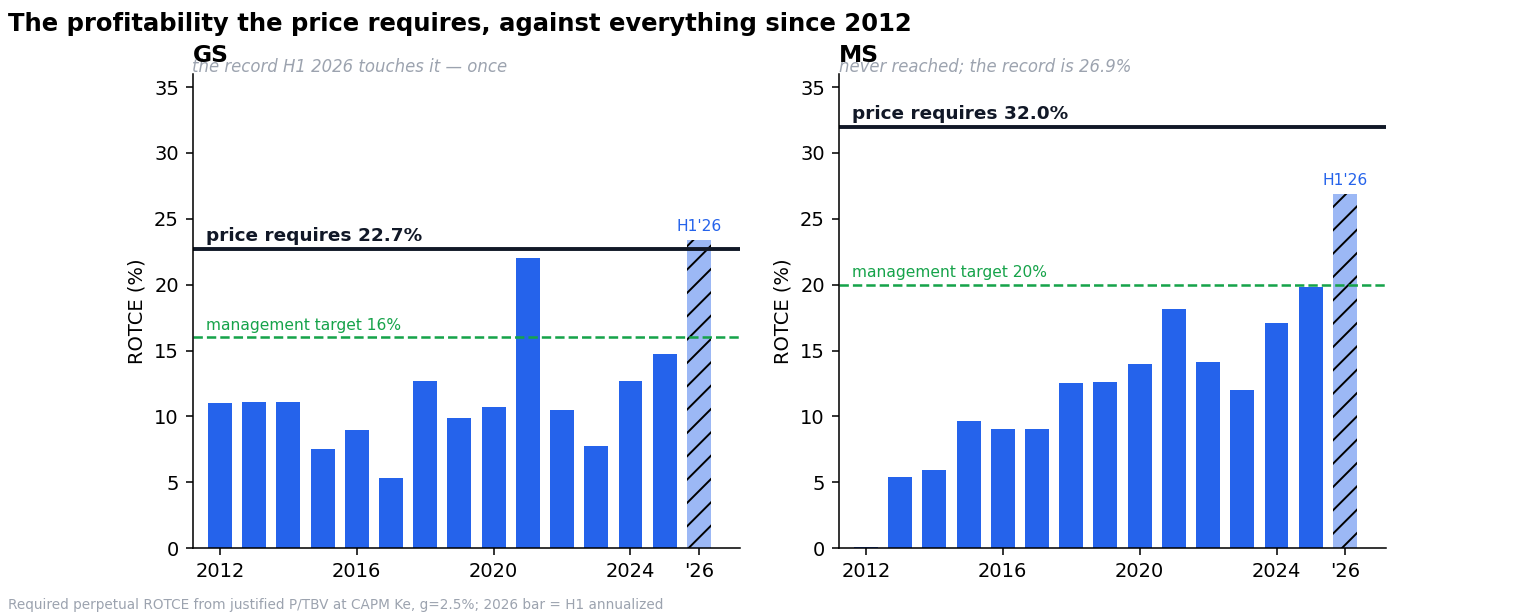
There is one more way to say all of this, and it is the standard bank vocabulary. Our models price the flows - the pools, the volumes, the asset gathering. But net income is just return on tangible equity times the equity, so the same claim can be restated per dollar of capital. At Friday's closes, Goldman must earn 22.7% on tangible common equity in perpetuity - a level it has reached exactly once, in the first half of 2026. Morgan Stanley must earn 32%, a level it has never touched; the record half-year was 26.9%. And because retained earnings compound the book at 3-4% a year, "forever" quietly includes a growth claim on top.
Where we could be wrong
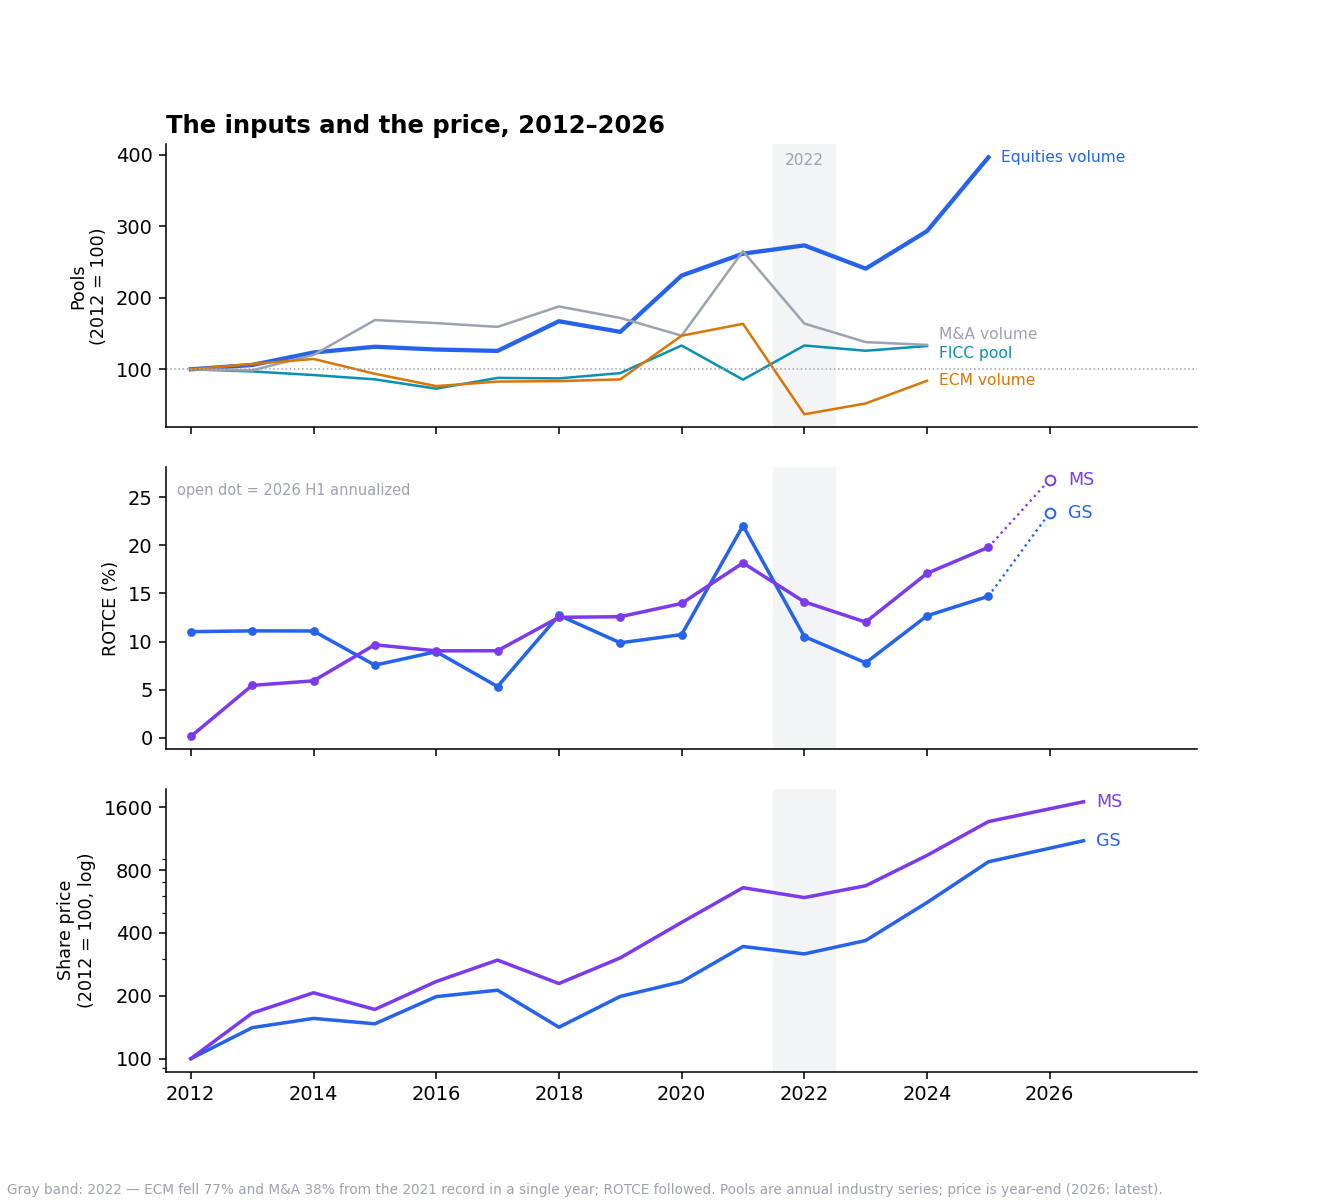
A careful reader will push back in a few key places. The strongest argument is the long term trend in equities trading volume. That currently sits at four times its 2012 level and it has not mean-reverted - electronification and market structure may have permanently raised the pool, and our flat anchor would then be too low. If true, we can adjust our valuation putting the equity volume at the top of the range. Even giving the equities stream 5% annual growth for a full decade is worth about $19 per share for Goldman and $7 for Morgan Stanley. Still not enough to get us to the market price.
The second argument is the discount rate - that franchises this durable deserve a lower one. Here we will simply point at the market's own behavior: these stocks trade with betas near 1.4. Pricing their cashflows as if they carried half that risk, while the shares themselves swing like high-beta financials appears to be a contradiction. We believe the current variability is from the market trying to price the possible futures. At the moment, they are pricing an exceptional run forever. When there are doubts, the market can revert quickly.
And the honest history: through-the-cycle models looked wrong for three straight years in 1996-1999. Being too early is the same as being wrong. We need a further catalyst to initiate a short or purchase puts on these names.
The sector backdrop
Our financials sector survey this week (PDF) makes two points that bear directly on this note. First, the record capital markets revenue is an issuance and financing cycle, not an advisory cycle. Citi's M&A revenue actually fell 4% in the record quarter, and at Goldman equity financing grew 91% - faster than the trading desks themselves. Financing revenue rides on the balance sheet, and balance sheet consumes capital. A record built this way is harder to hold at record returns on equity, not easier. The early cracks are already visible: IPO proceeds are up 800% this year but deal count is down 22.5% - a handful of mega-listings - and SpaceX now trades below its IPO price while Visma's €19B listing was postponed.
Second, the rate path flipped inside two weeks. Sector guidance for 2026 was written assuming Fed cuts; on the oil shock, futures now price two hikes by year-end and Schwab has already re-guided to a December hike. A hike freezes the issuance window that generated the marginal revenue. Realized inflation is still decelerating, so this can unwind - but it is a live demonstration of how fast the inputs under this valuation can move.
What would change our mind (October 13-15)
We are pre-committing to the evidence that would prove the market right, so that we score ourselves honestly later. The third-quarter prints in mid-October are the first real test:
- Trading and underwriting revenue at or above the record second quarter, without a volatility spike doing the work. Two consecutive quarters at the record converts "peak" into "baseline."
- Goldman ROTE holding above 25% and Morgan Stanley above 26% for both remaining quarters of the year.
- Wealth management flows sustaining a double-digit annualized pace at Morgan Stanley, and Goldman raising its alternatives fundraising guidance again.
- The rate scare unwinding - oil retracing and hike odds fading - so the issuance window stays open into year-end. (Two weeks ago this item would have read "two rate cuts." The forward curve now prices two hikes. That is how quickly the inputs move.)
If the first two land, the record is becoming the baseline and we will say so plainly. The tell at the October prints is backlog commentary, not reported revenue - and the comparisons get materially harder from Q3 with these records in the base.
The stake in the ground
Before we close, walk it down the other way. At $417 of tangible book value per share, a buyer of Goldman today pays $644 on top for the franchise. Our generous through-the-cycle model says the franchise above book is worth about $277. Extending the boom pays for a little more of it. Making the boom permanent pays for most of it. Nothing pays for the last $102 except the belief itself.
We are writing this note today not to initiate a short position. As the old line usually attributed to Keynes goes, "The market can remain irrational longer than you can remain solvent." However, we are putting a stake in the ground here saying that we think that the valuations are too high. This market is not likely to fall apart overnight. We will see degradations and when they become clear, we can initiate a short or purchase put options to monetize the reversion to our fair value. The cost to carry without a catalyst for the valuation to change is too high to just wait for the market to correct. Still, we believe the current price far exceeds what can be computed from known inputs.